

Faceting: Quickly comprehend what’s inside your data

Faceting splits a large dataset into multiple smaller subsets (“facets”).
Why it matters: Faceting reveals variations and similarities across different facets. It allows you to:
- Do a detailed comparison without losing the broader context.
- Understand interactions between variables, spot outliers within facets, and uncover hidden trends that might be missed in aggregated data.
In this blog, we’ll help you apply ideas and concepts covered in Fundamentals of data and Data audit and cleaning. We’ll follow five steps:

1. Look at the data

2. See the columns

3. Imagine the hypothesis

4. Evaluate the hypothesis

5. Be ready for unknowns
1 – Look at the datasets
Download this dataset: IPL-transformed.csv
Applying ritvvij.parrikh.com/fundamentals-of-data/14068/#whatIdentify three different aspects:
- Skills to store and access the data: The data is in CSV format and hence it is machine readable. The file size is small enough to be opened on a computer.
- Domain knowledge to understand the nuance: The data is able the Indian Premier League, a dataset about cricket (sports). Like is with most two-player games, the csv has following datapoints:
- Match number: One season has many matches. Which match number was it
- City: Where did they play
- Toss winner: Who gets to play first
- Winning team: Who won the match
- Margin: How large was the win
- Skills to use the data: This is what we’ll explore in this blog!
Data Provenance
Applying ritvvij.parrikh.com/data-audit-and-cleaning/14073/#provenance
Where:
- Source: kaggle.com/datasets/nikhilsharma1212/ipl-complete-player-performance-2008-2022
- Download it
- Open folder IPL
- Within that file name: IPL_Matches_2008_2022.csv
When: This has data for all the matches from 2008 to 2022.
Transformations done and why:
I want to simplify the dataset for the audiences of the workshop to understand. Hence:
- I expect most workshop audiences will know about Indian cities. Hence, I’ve collapsed team names down to the state’s capital they represent. For example:
- Royal Challengers Bangalore became Bangalore
- Rajasthan Royals became Jaipur
- Sunrisers Hyderabad became Hyderabad
- Chennai Super Kings became Chennai
- Delhi Capitals became Delhi
- Lucknow Super Giants became Lucknow
- Gujarat Titans became Ahmedabad
- Punjab Kings became Chandigarh
- Kings XI Punjab became Chandigarh
- Kolkata Knight Riders became Kolkata
- I also renamed Navi Mumbai to Mumbai for simplicity.
Warning: The first transformation is lossy because Punjab had two teams consecutively and now both have been collapsed into one name.
2 – See the columns
Theory:
- What is the color of an apple? Normally, it is red color. Hence, normal means what is generally expected.
- But then there are even green and yellow apples! You can identify how different is a particular numerical datapoint using Standard Deviation and Median Absolute Deviation.
- What if you find a purple apple!!? That’s an absolutely special find. You can find special numerical data points like this using Z-score.
We’ll be using an open source tool released by Google called ‘Facets Overview.’ It does basic summary analysis and other cleanliness checks for all the columns in your dataset.
Here’s how to use it.
- The tool we are going to use only works with small datasets because it processes the data in your browser itself. Go to pair-code.github.io/facets/#facets-overview in Chrome or Microsoft Edge.
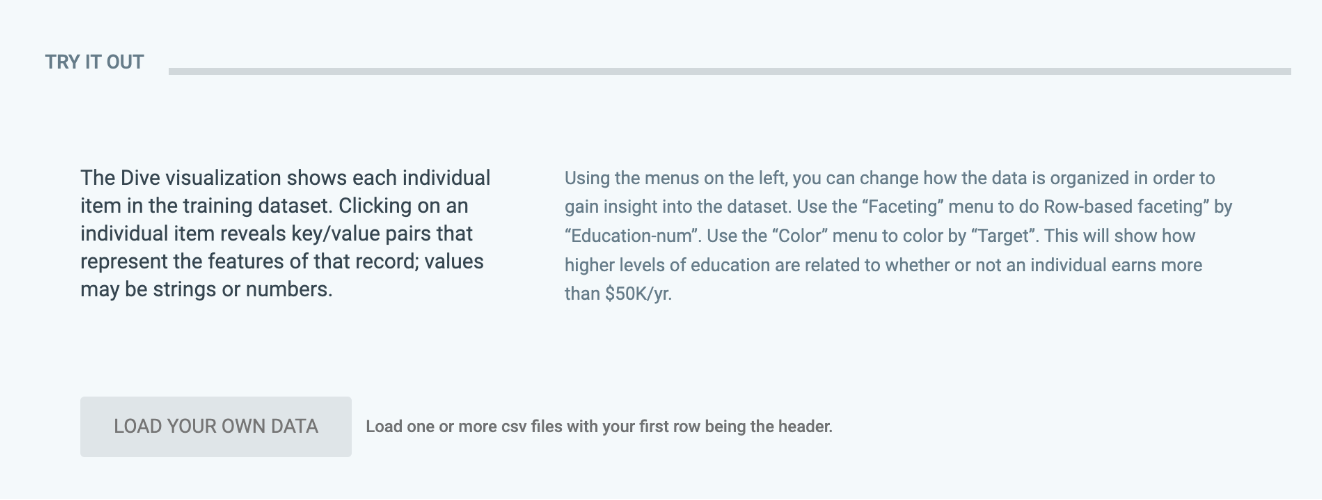
- Scroll down to this button and upload your data
- Upload the downloaded CSV file.
Here’s what we observe.
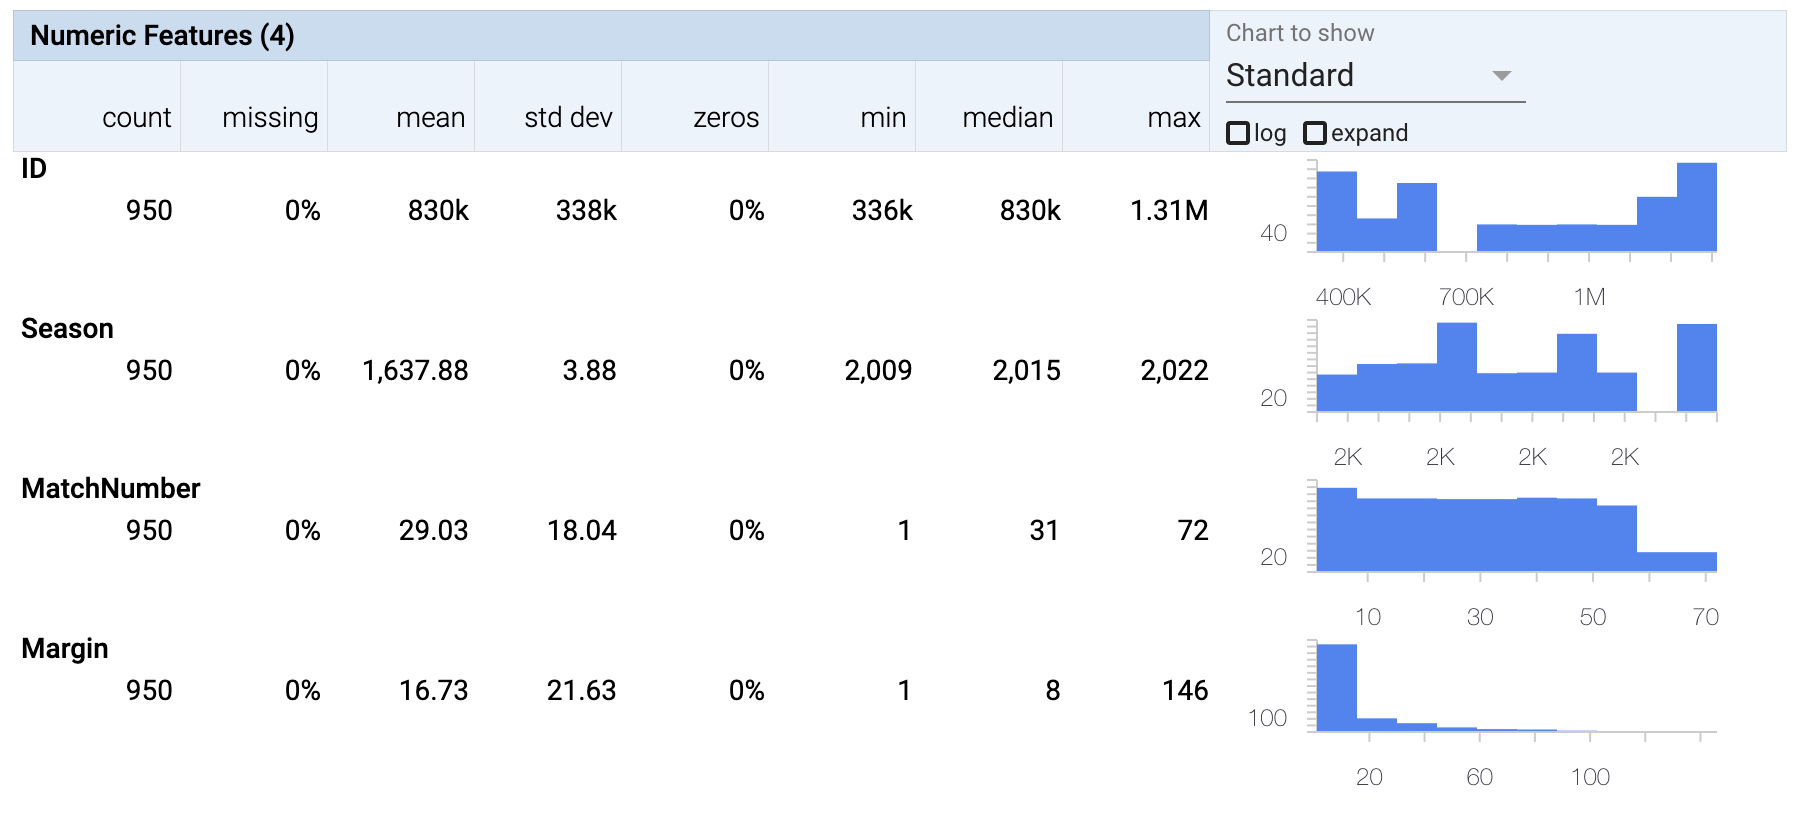
Numerical columns
- We can ignore the column ID because it a unique identifier and doesn’t hold insights.
- If we look at the margin column, then you can see from the histogram that most of the wins have been narrow wins and only a few extreme outcomes.
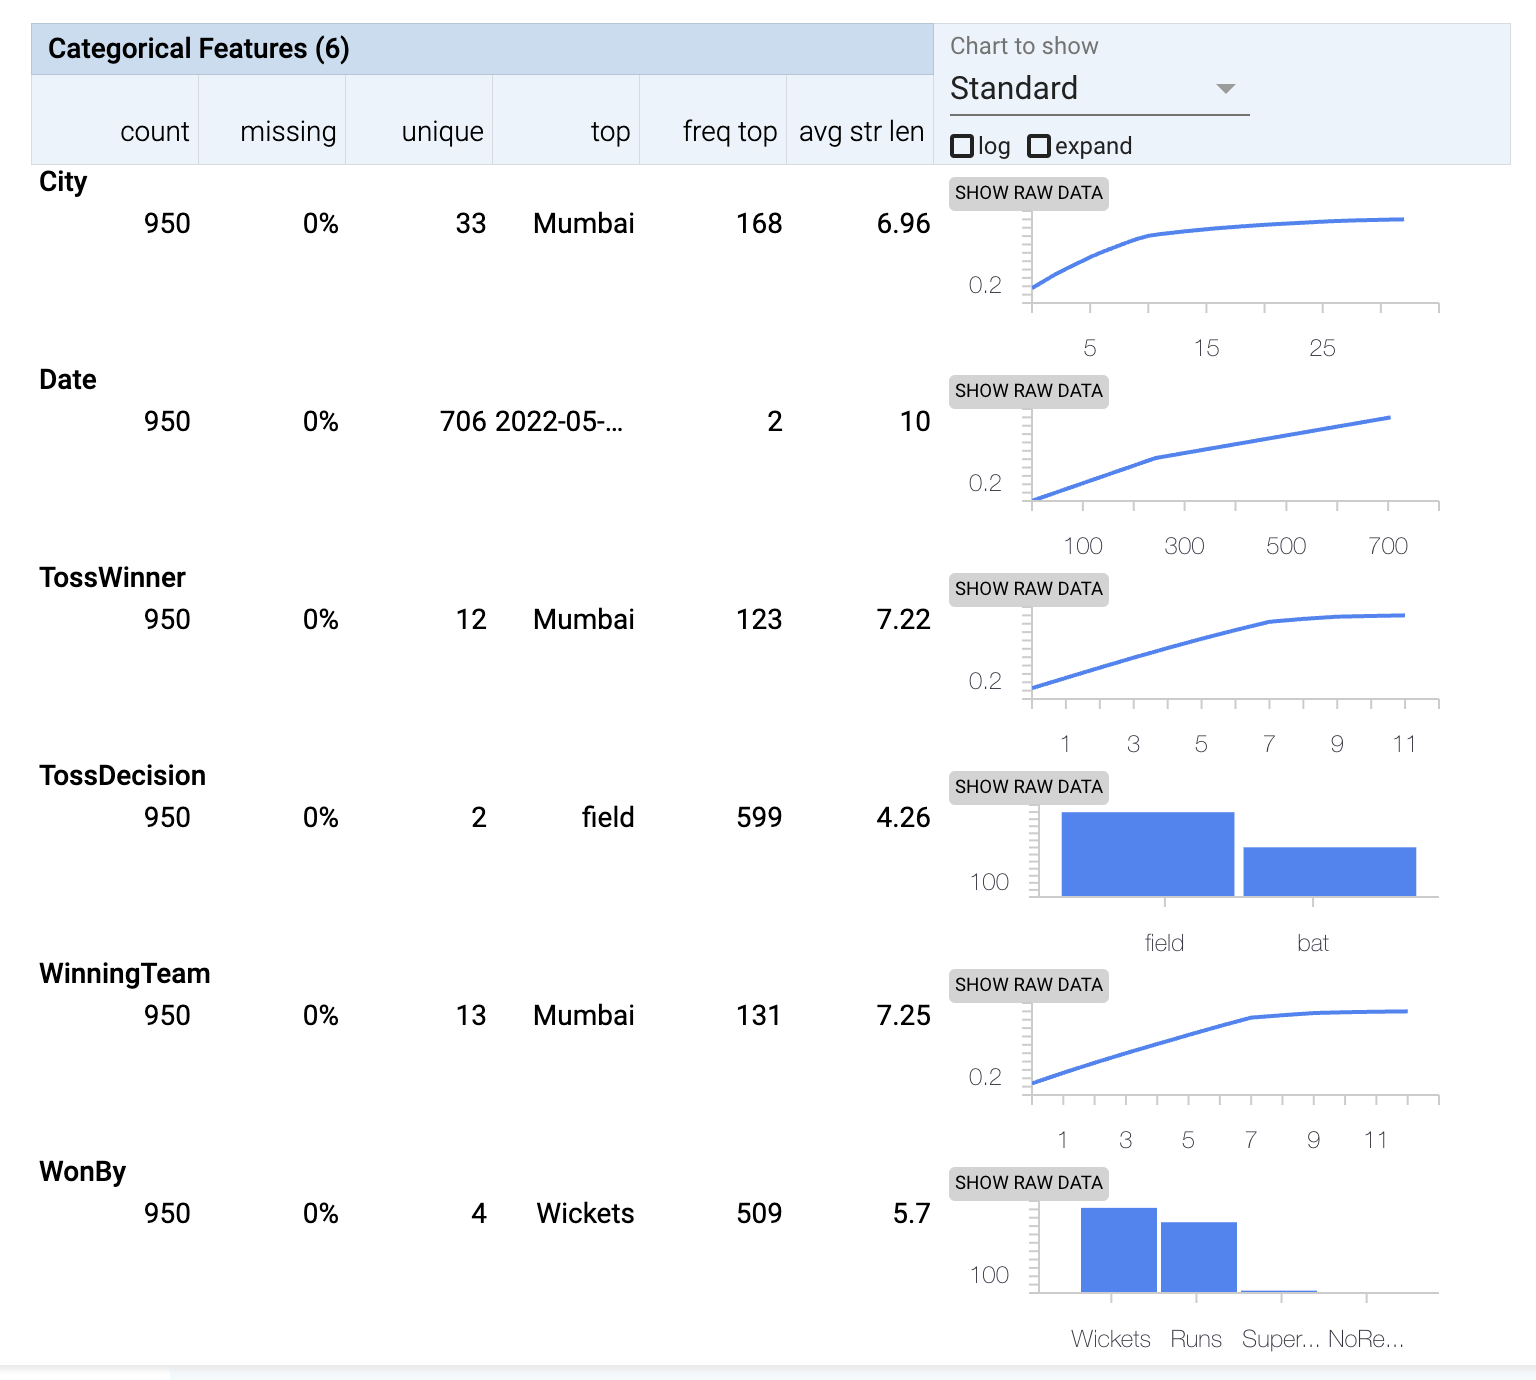
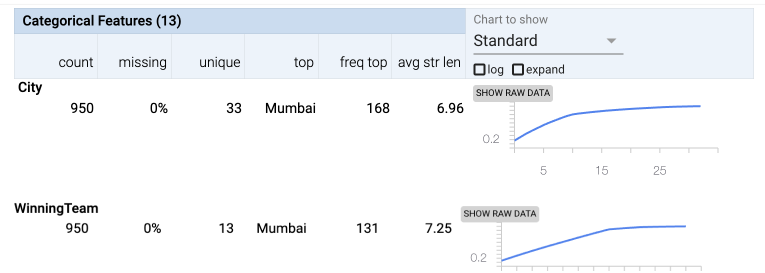
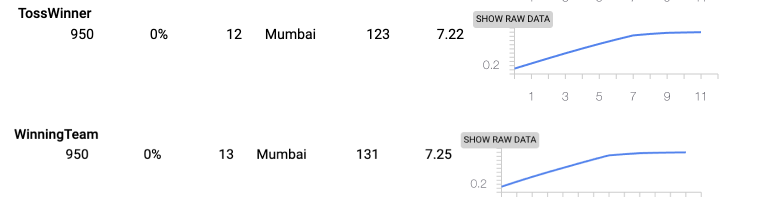
Categorical columns
- City: Most matches were played in Mumbai.
- Toss Winner: Most tosses were won by Mumbai.
- Winning Team: Most matches were won by Mumbai.
3 – Imagine the hypothesis
Below are some of my hypothesis:
- Margin of winning should be higher early on because early in any tournament there will be weak teams and strong teams.
- Certain stadiums have a tendency to generate outsized wins because different the type of soil and weather can impact the game.
- Teams win more matches in their home stadium.
- Teams that win the toss tend to win the match.
- Teams that win the toss in their home stadium tend to win the match.
4 – Evaluate if the hypothesis
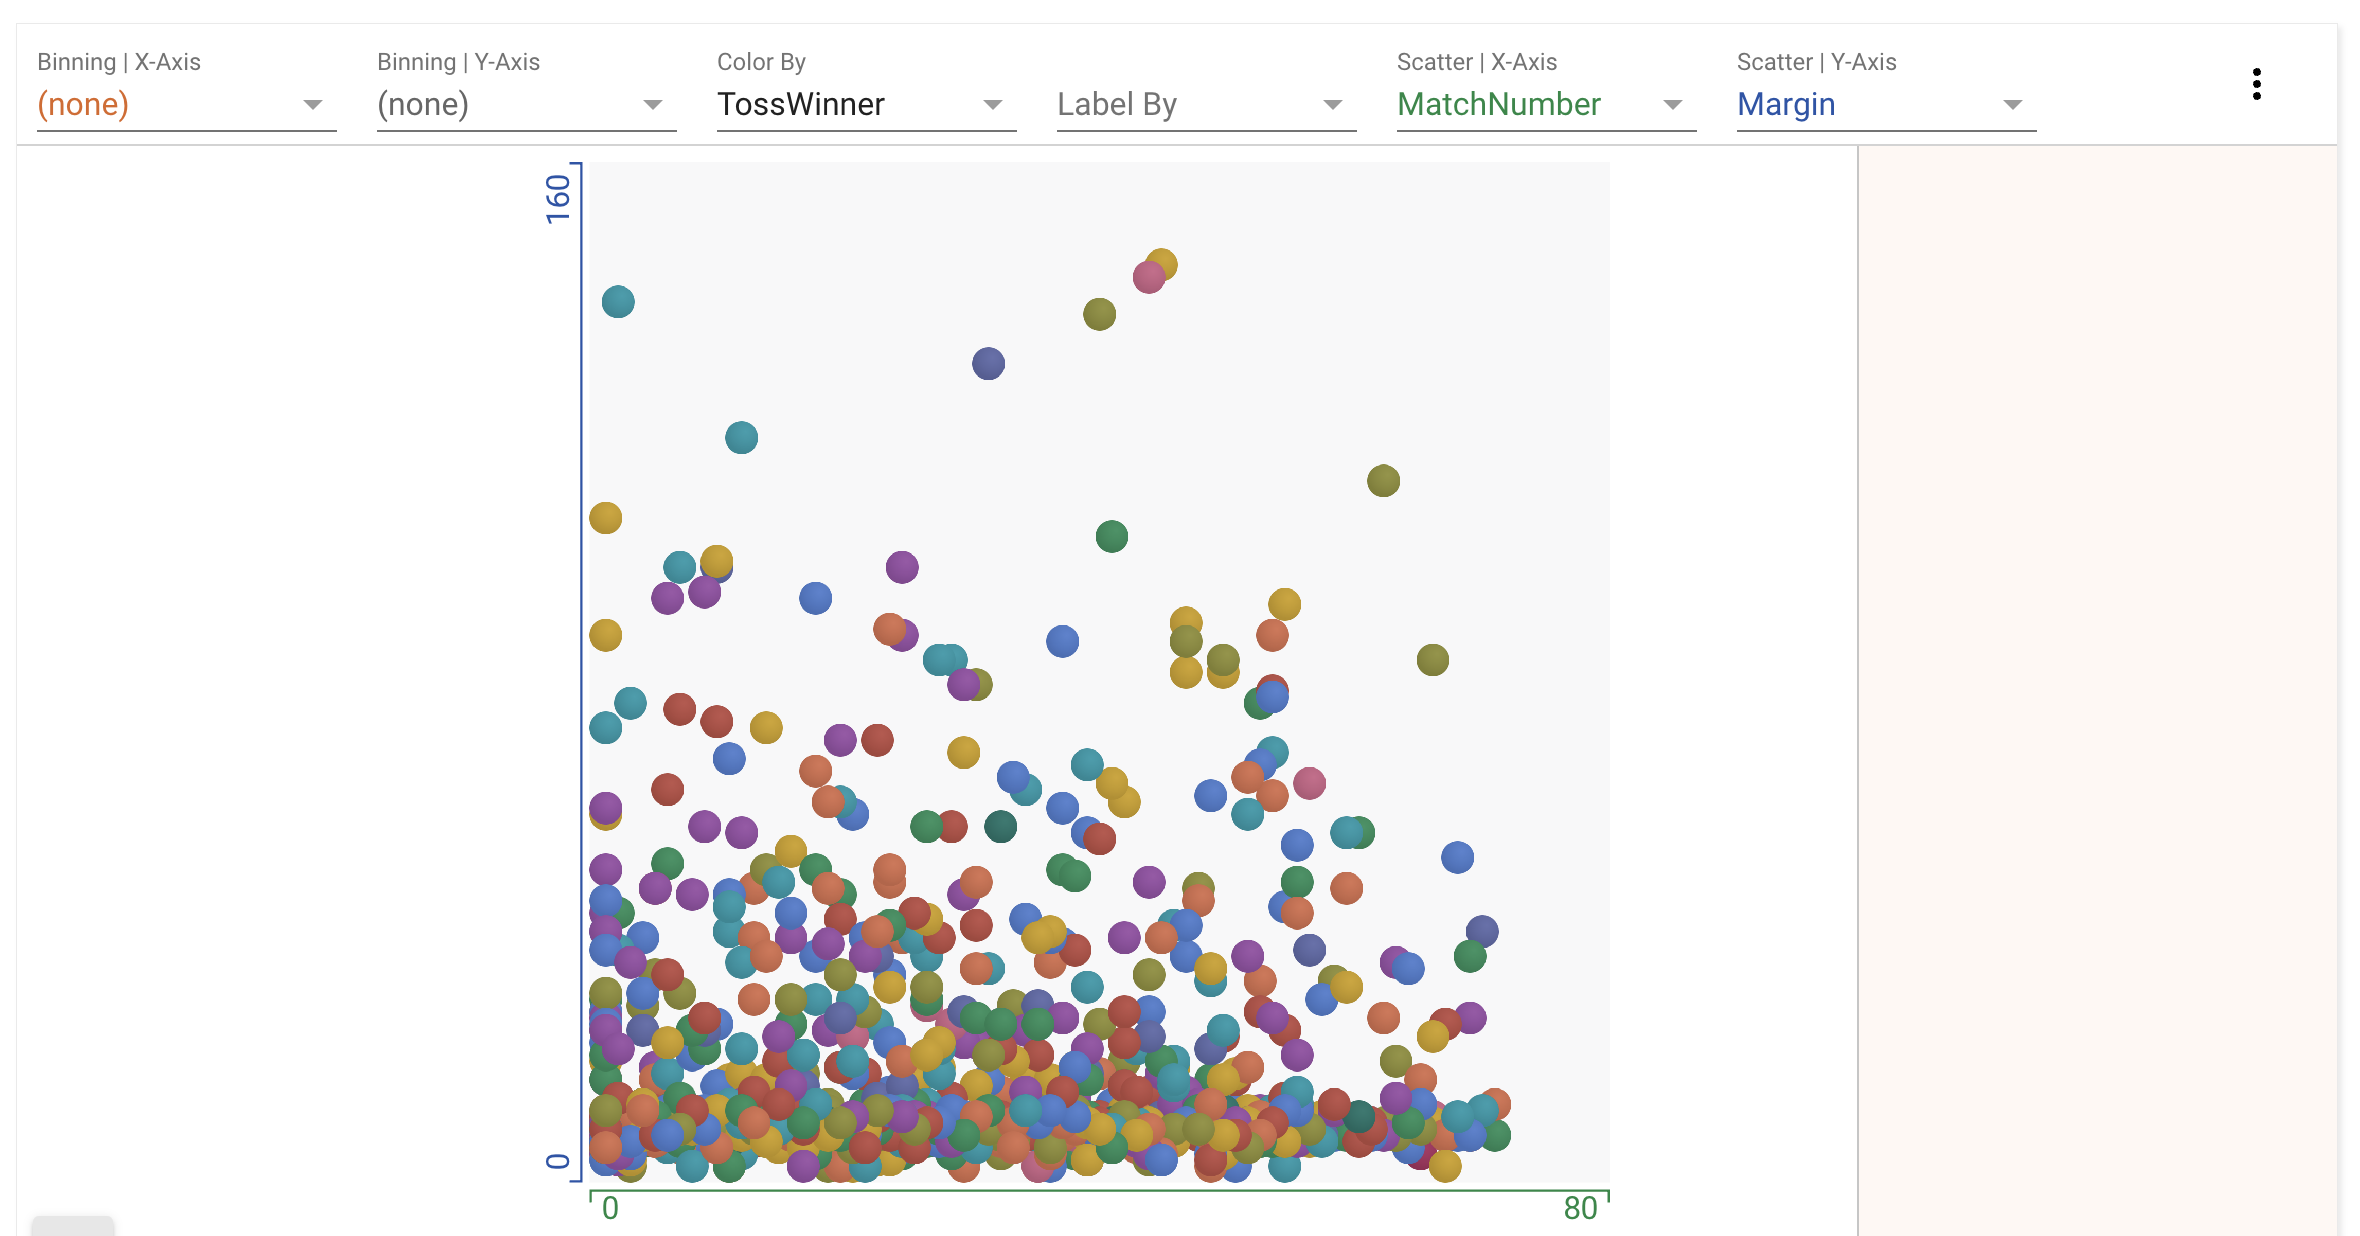
We’ll be using an open source tool released by Google called ‘Facets Dive.’ It helps you explore relationships between data points across all of the different features of a dataset. Each dot is a row in your data.
Here’s how to use it.
- The tool we are going to use only works with small datasets because it processes the data in your browser itself. Go to pair-code.github.io/facets/#facets-dive in Chrome or Microsoft Edge.
- Scroll down to this button and upload your data
Now let’s test some hypothesis:
Hypothesis: Margin of winning should be higher early on.
Hypothesis: Certain stadiums have a tendency to generate outsized wins.
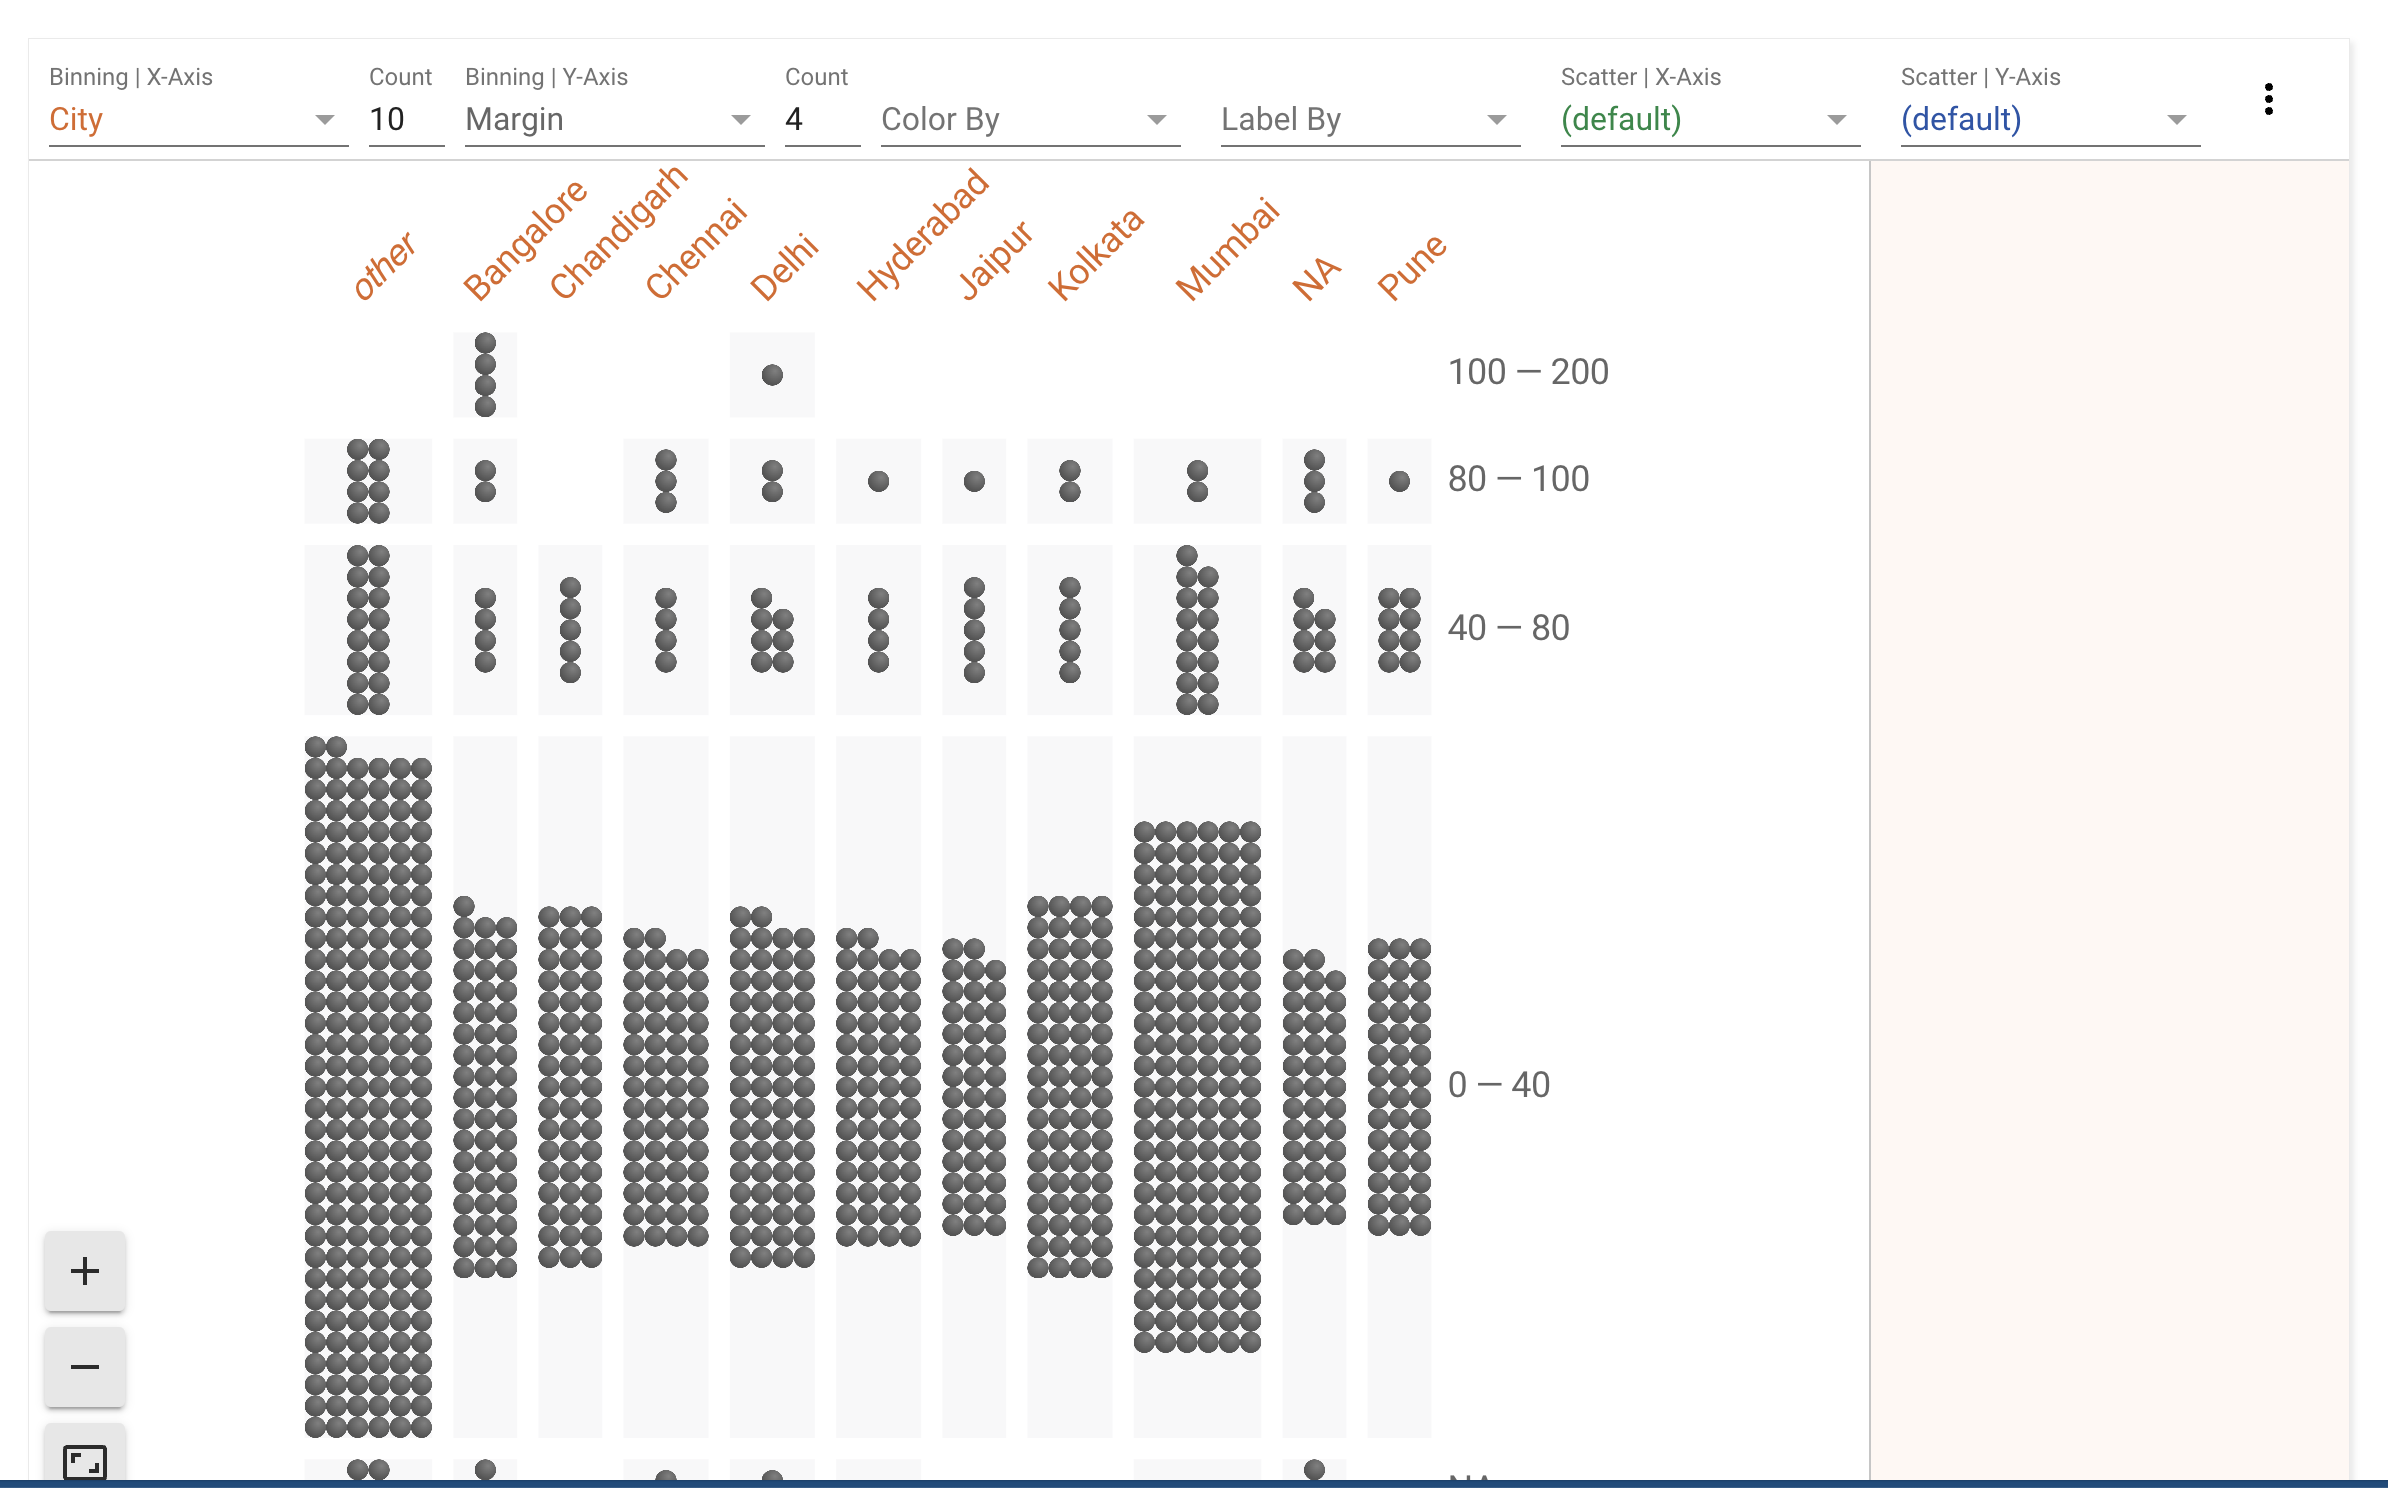
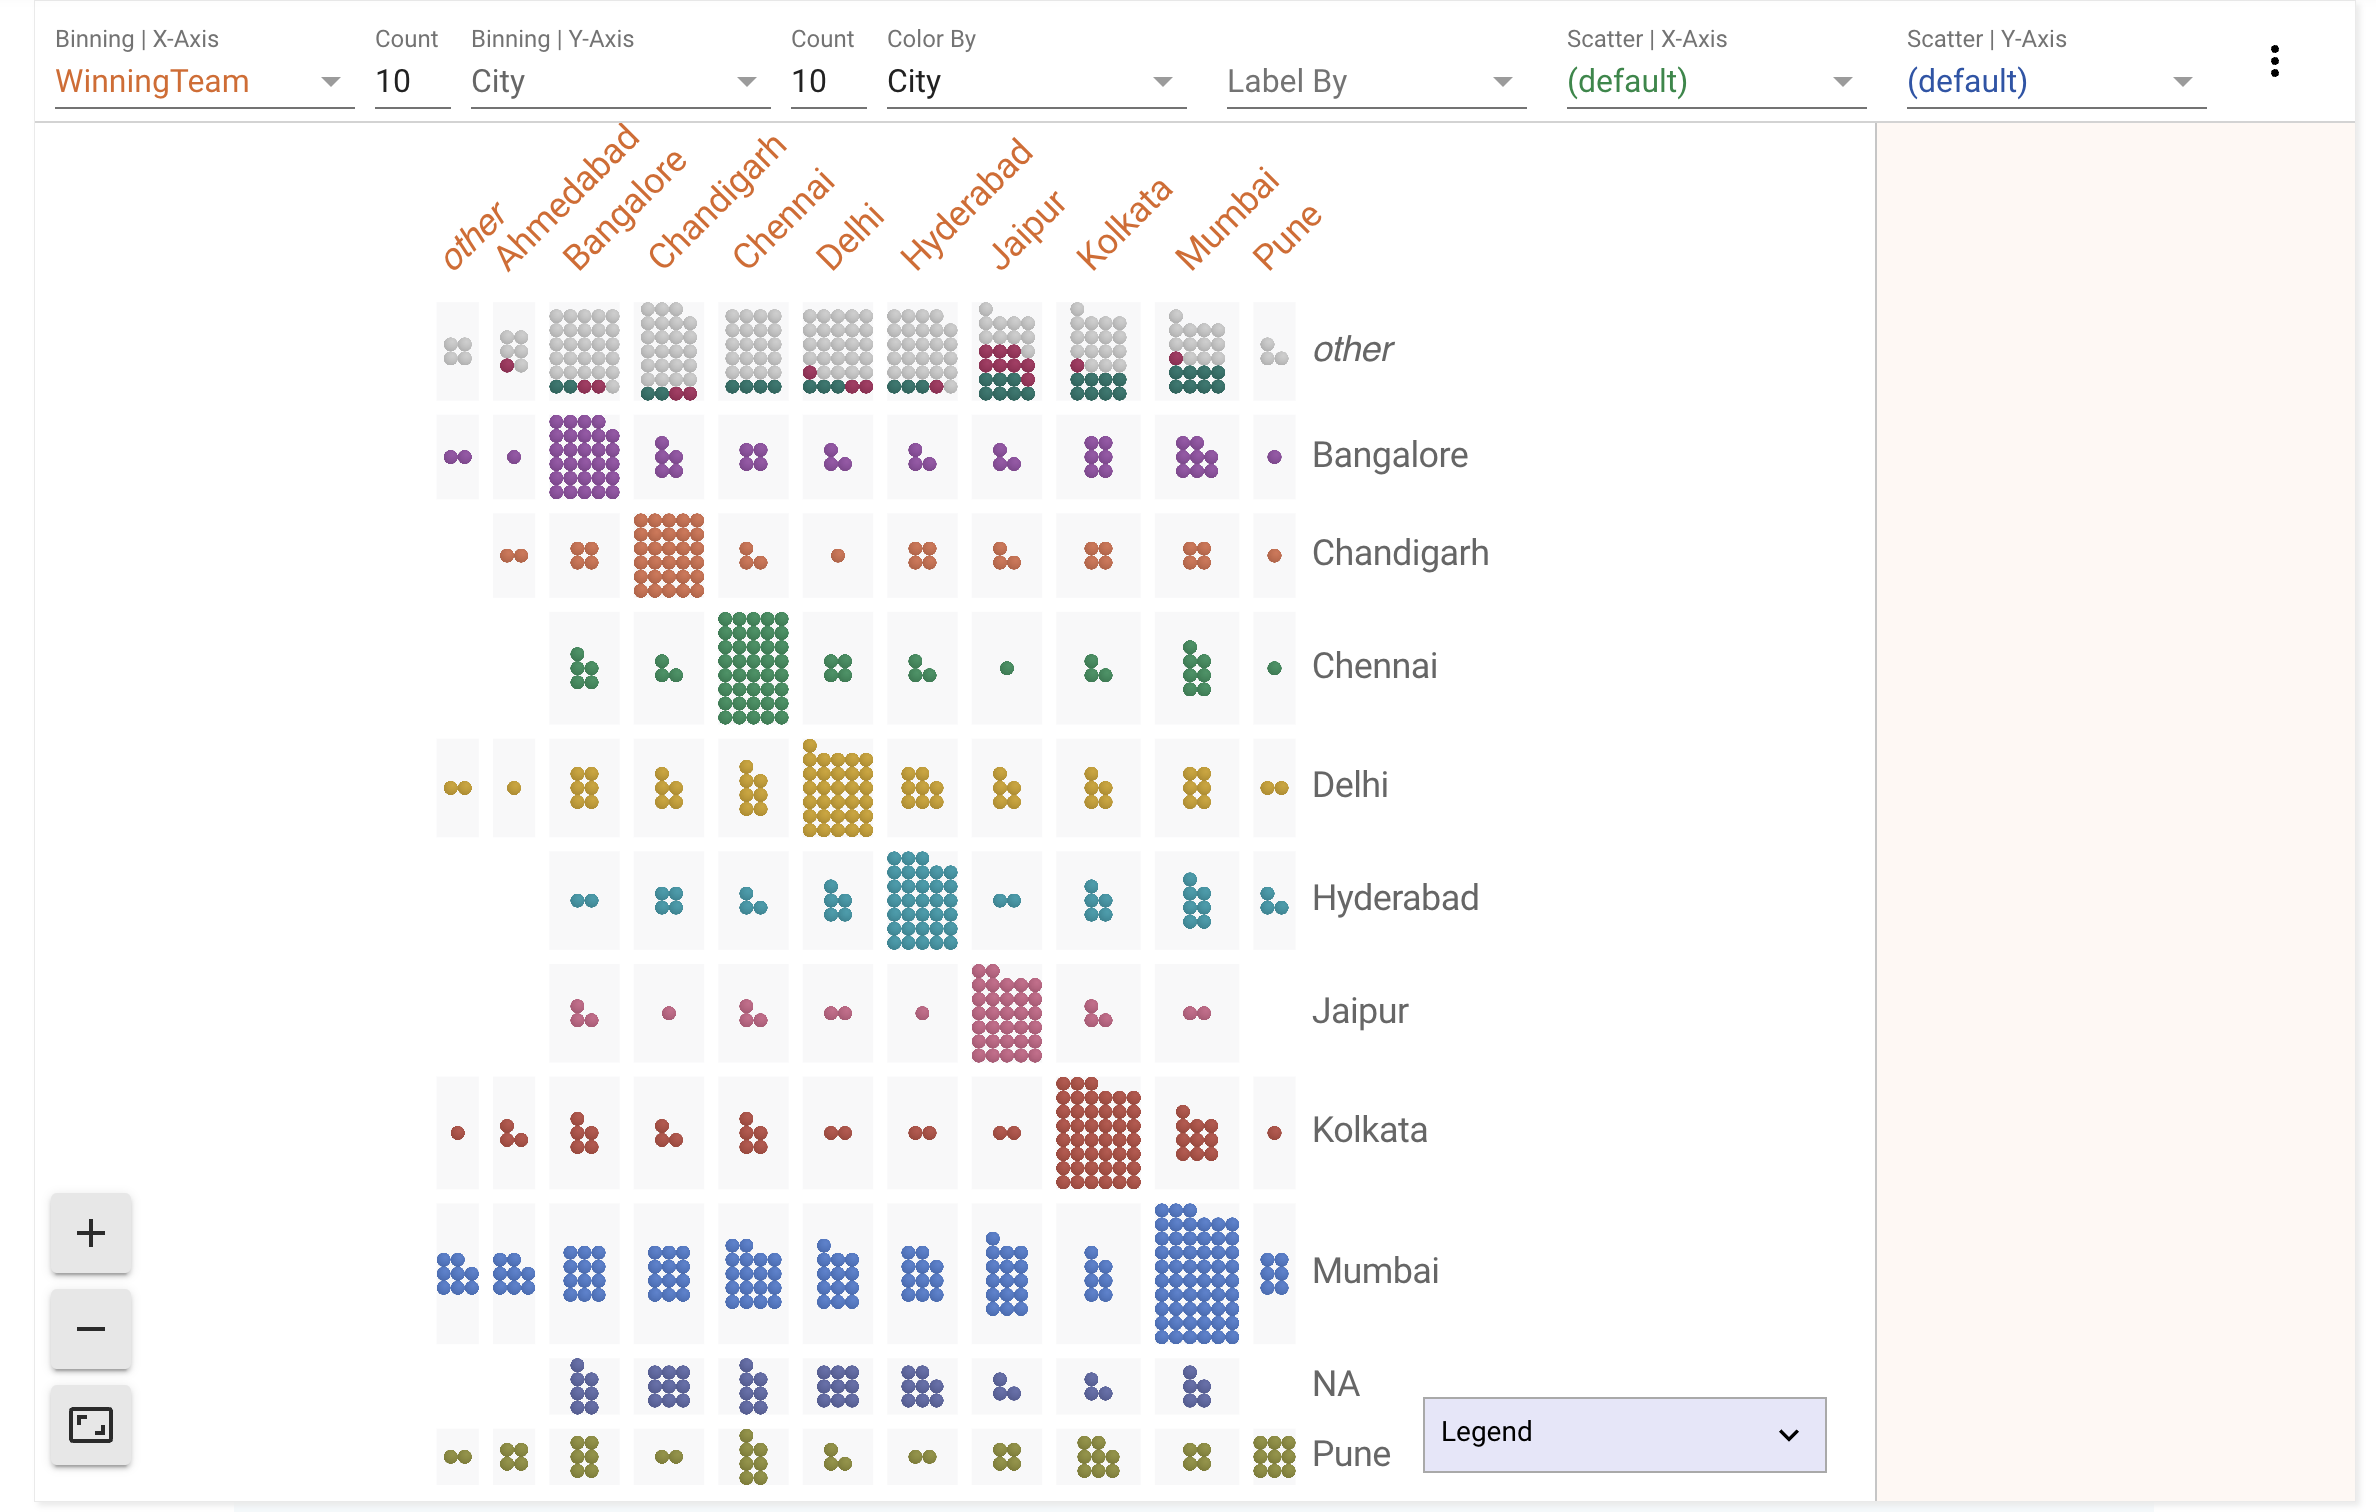
Hypothesis: Teams win more matches in their home stadium.
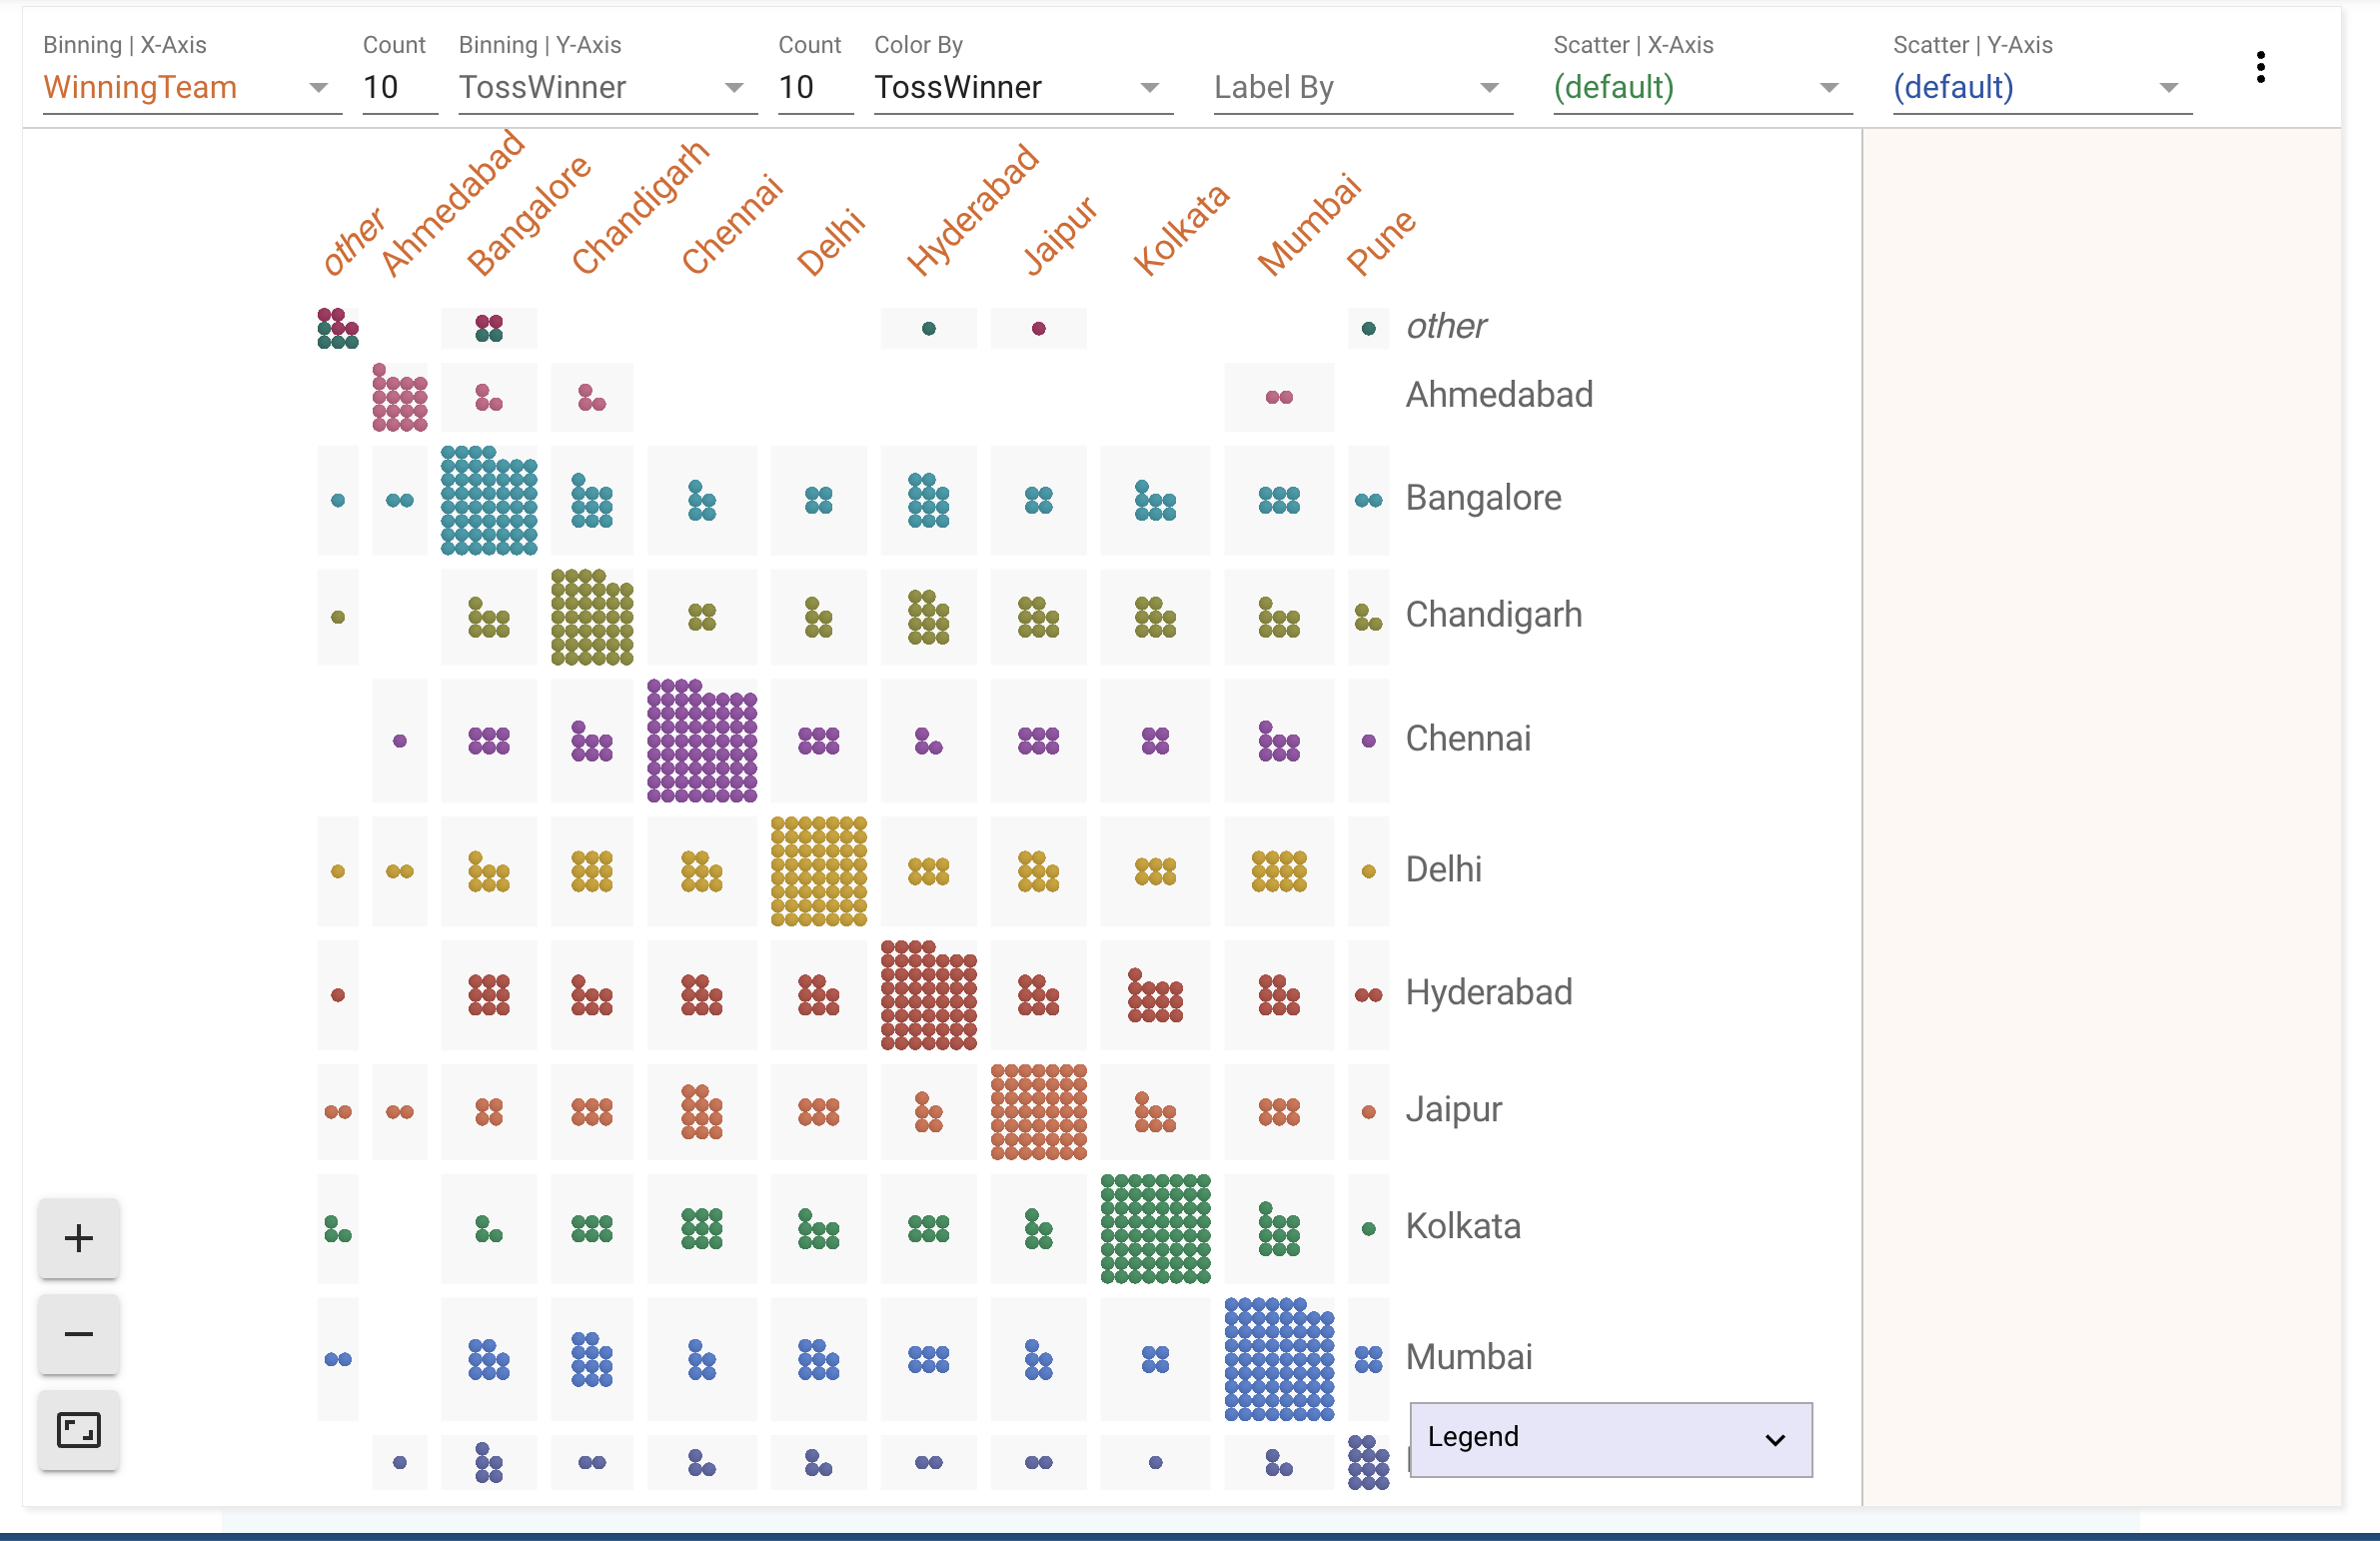
Hypothesis: Teams that win the toss tend to win the match.
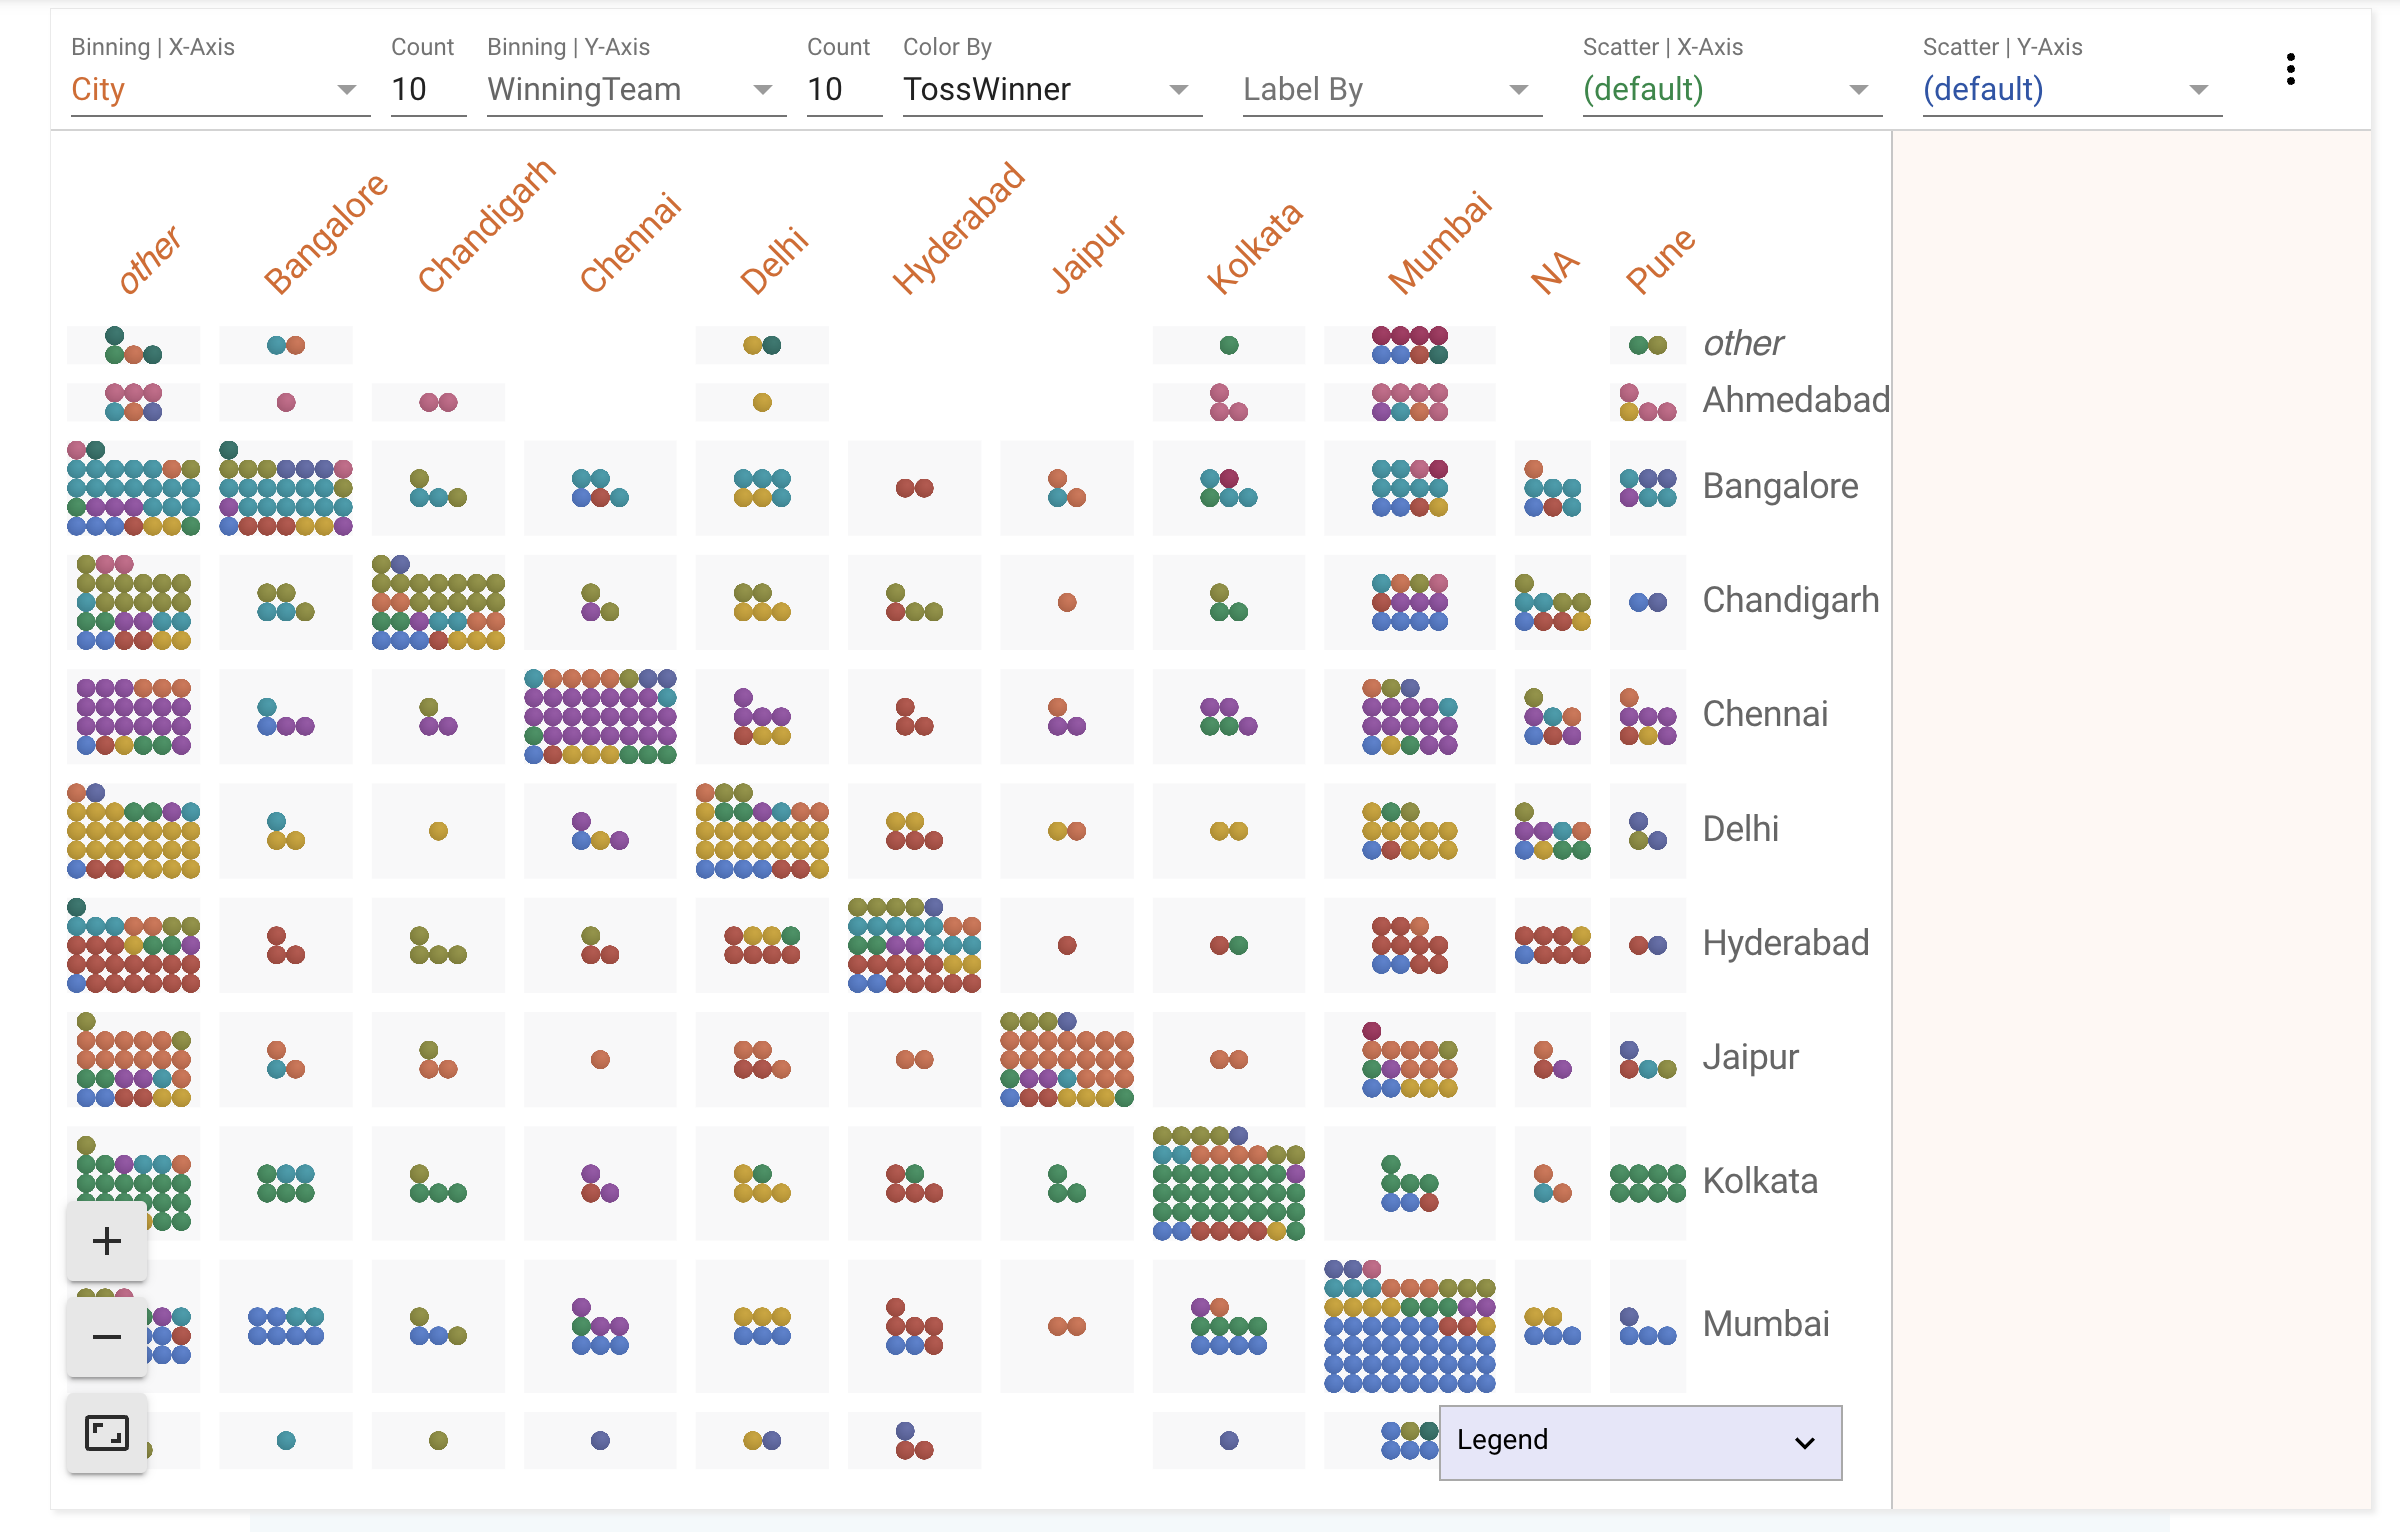
Hypothesis: Teams that win the toss in their home stadium tend to win the match.
Theory:
- You can find a linear relationship between two numerical columns using Correlation.
- You can try to compare an apple and orange by abstracting both to fruits using Normalization.
5 – Be ready for unknowns
Just when you think you know everything, your domain knowledge expert — CEO, Analyst, Beat Reporters — one who has deeper judgment will tell you something that will make you relook at things again!
Here we’ve bucked win margin (a number) by won by. Prima face, looking at this one can conclude that when a match is won by wickets, then the win margin is less!
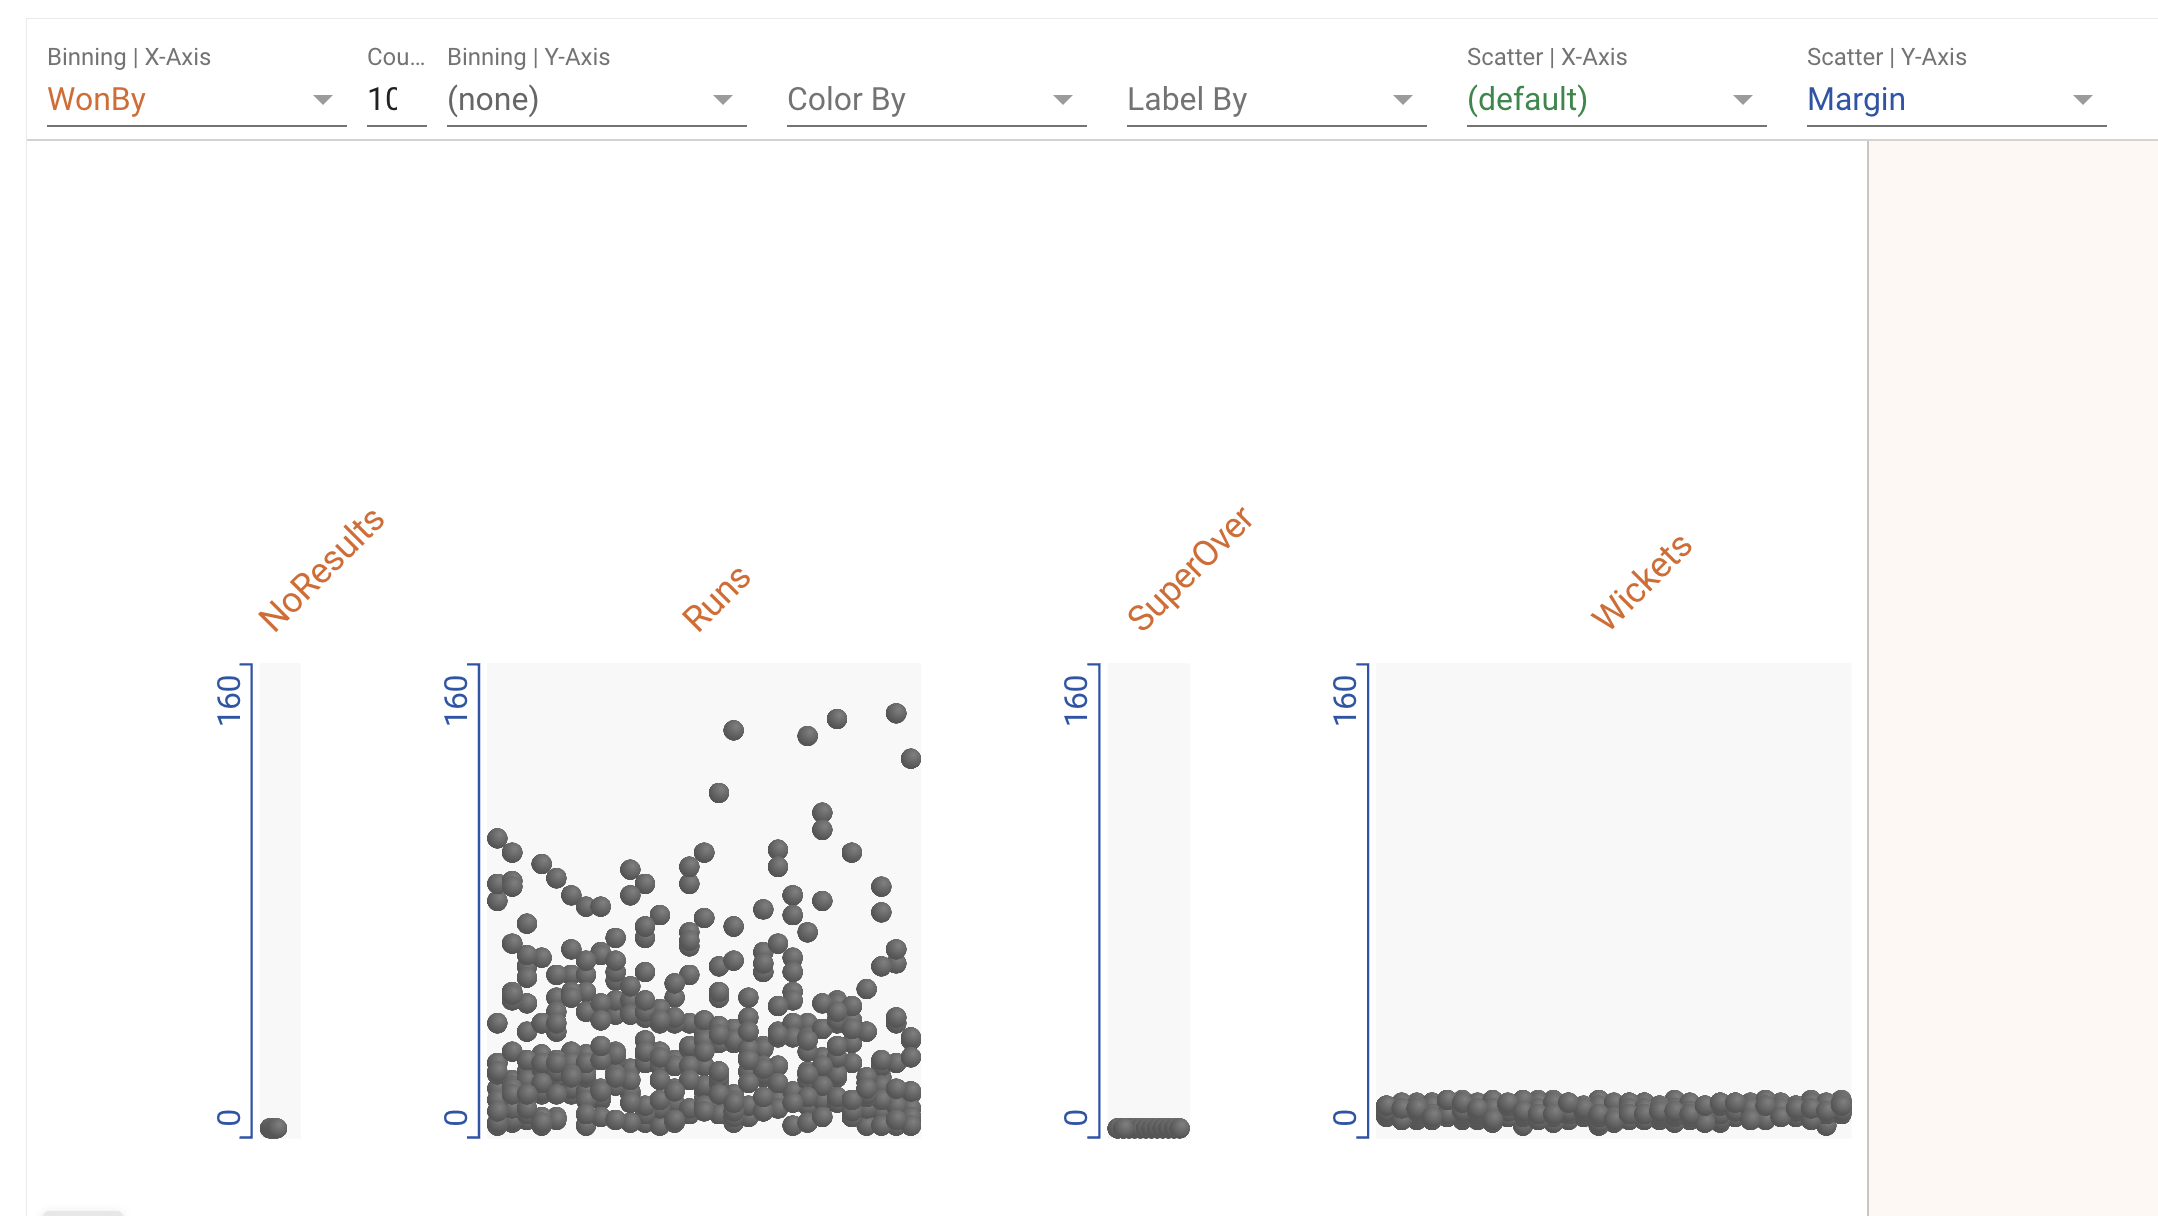
However, thats not true. This is where domain knowledge comes in.
In cricket, if a team wins by wickets, that means that the team batting second chased the target. In such scenarios, the winning margin is not reported in runs (min: 0 to max: 200+) but my wickets (min: 0 to max: 10).