

Fundamentals of data

When you first see something new, you ideally want to know what is what and its properties. Fundamentals of data covers what, why, where, how, and how much of data and characteristics of individual columns of data.

What is data?
Data is nothing other than we humans storing our experiences, thoughts, and actions on paper or an electronic format.
With every dataset, identify three different aspects:
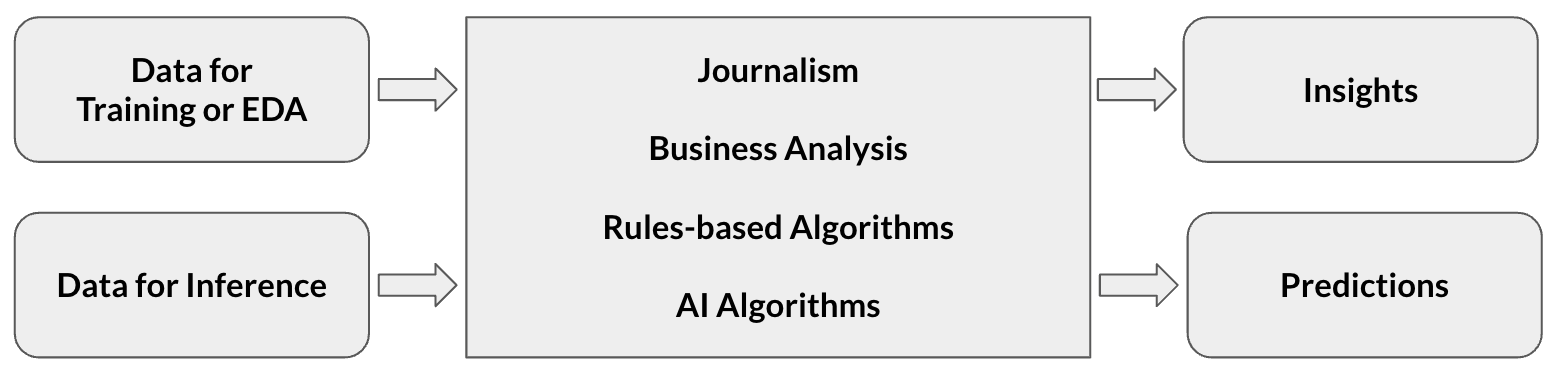
- Domain knowledge to understand the nuance: Typically, you need domain knowledge, beat experience, or specialization to operate in a specific domain like meteorology, social media, elections, or foreign policy.
- Skills to store and access the data: To record, you need to be diligent and have the technical equipment and know-how to warehouse or store information.
- Skills to use the data: Finally, to draw insights, you need technical skills (and tools) to clean, analyze, and visualize the stored information. Finally, you communicate what you learned from the analysis.
| Domain | Storage | Insights |
|---|---|---|
| Wind | Record measurement tools | Ancient sea travel |
| What’s on your mind | Sentiment on trending topics | |
| Vote | Election Commission | Political change |
| State Dept. wires | Wiki Leaks | Backdoor foreign policy |
Most jobs that are information processing problems — trading, journalism, business operations, product management, etc. — rely on these principles albeit in different words.
Why does data matters
Data helps you:
- Gives you a better grounding of reality
- Helps you plan scenarios and forecast
- From an artificial intelligence point of view, AI is nothing but ‘data interpretation’ or ‘pattern matching’ or ‘reasoning over data’
Hence, you should care about your data and maintain it well. Otherwise, in most of these applications, you’ll put garbage in (bad data) and get garbage out (bad insights).
Where can you find datasets
Primary dataset is the data you collect yourself. This typically includes qualitative surveys, interviews, internal enterprise data, etc. Secondary data is datasets that someone else has collected. For example, government or open-source datasets.
You can find data inside your organization, from governments or institutions that publish open data, APIs from software as a service solutions, and of course scientific and academic institutions.
Internal data
- Clickstream dataset is used for segmentation, cohorts, personalization, etc.
- Search queries and comments dataset can tell you more about user needs.
- Subscription conversion and retention data can help you build propensity models.
Open data
- Government portals: India, Pakistan, Malaysia, Singapore, etc.
- Common governance and public policy data sources in India are rbi.org.in, mospi.nic.in, planningcommission.nic.in, indiabudget.nic.in, ncrb.nic.in, mha.nic.in, dise.in, etc.
- Trans-governmental institutions: UN’s population data portal, World Bank’s APAC data, Asian Development Bank’s data portal, UNICEF’s statistics, etc.
- Large scale numeric datasets like Stock Market feeds or cryptocurrency exchanges or pollution data or consumer price index
- Finally, there is an aggregator of data portals
Digital data
- APIs from tools like Twitter, Zapier, etc.
- Blogs that people write
- News articles
Things that you can collect
- Speeches from politicians, business leaders, etc.
Size matters!
Now-a-days the cost of warehousing content has dropped significantly. But then quantity and quality (resolution) of data that we are storing has also drastically risen.
| Data Type | Computer Size | Storage Size |
|---|---|---|
| 1000 numbers | 2-4 bytes per number | ~2-4 kb |
| 1000 English words | 5 letters per word * 1 byte per letter | ~ 5kb |
| 1000 words in another language | 5 letters per word * (2-4 bytes per letter) | ~ 10-20 kb |
| 1000 photos from iPhone | ~ 2 – 3 Mb per picture | ~ 2 Gb |
Given this based on financial considerations, you should plan out storage and processing infra costs before picking up large-scale artificial intelligence work.
What you can do with data
The size of your data determines what you can do:
- 100s of rows: User surveys and interviews, basic insights in presentations
- 1000s of rows: Predict outcomes. For example, sports matches, election forecasts, propensity models.
- 100ks of labeled rows: You can also train GPT to do certain tasks.
The more complicated the task and the lesser the error margin you want, the greater the quantity of data.
Technical skills you’ll need
The size of your data determines which data analysis tools (and thus the technical skills ) you’ll need:
- 100s of rows: Typically such datasets are pre-tabulated and aggregated and thus have high signal to noise ratio. You can analyze them manually, use Datawrapper.de or use tools like ChatGPT.
- 1000s of rows: Typically, at this size, you’ll prefer to use MS Excel, Google Sheets, Tableau, or analytics tools built on GPT like defog.ai or datachat.ai
- millions of rows: For larger datasets, you need a proper database and analysis tools like Tableau or programming languages like SQL or Python or R, or ChatGPT based tools that connect to the database.
- more than that: Anything larger than that, you’ll need high-end data processing pipelines.
Now we shift from talking about the entire dataset to talking about individual columns within a dataset.
Understand the characteristics of each column of data
Let’s peel the onion in layers.
Structured v/s Unstructured
The concept of structured and unstructured data isn’t new. Let’s take a dated example.
Below is one person’s death certificate. Much like a news article or a Google Document (Word file) this is an unstructured dataset because it cannot be readily analyzed.

However, the moment you collect many death certificates and compile it into a table (like a Google Sheet) for analysis, it becomes structured data.
- In the 17th century, Edmond Halley used such tabulated sheets to derive probability of deaths and insurance premiums on annuities.

Quantitative v/s Qualitative
Quantitative data (or metrics) are numerical metrics that can be measured, i.e., how many sandwiches you’ve.
Qualitative data (or dimensions) tell you about the properties/attributes or aspects of the sandwich: Type of bread,
Qualitative data can be further split into following properties:
- Continuous: All quantitative data is continuous. However, some forms of qualitative data is also continuous, for example time-series data, or options in a survey (Likert Scale – Strongly agree, Agree, Neutral, Disagree, Strongly disagree.), etc.
- Categorical: All qualitative data that isn’t continuous is categorical.
Other properties
- Time-series: Here you store when did an event happen in the form of Date, DateTime, Year, Financial Year, Day of the Week, Hour, etc. This is the most common form of data.
- Geographic: Here you store where did this event happen in the form of country, iso codes, state, districts, city, latitude and longitude, etc.
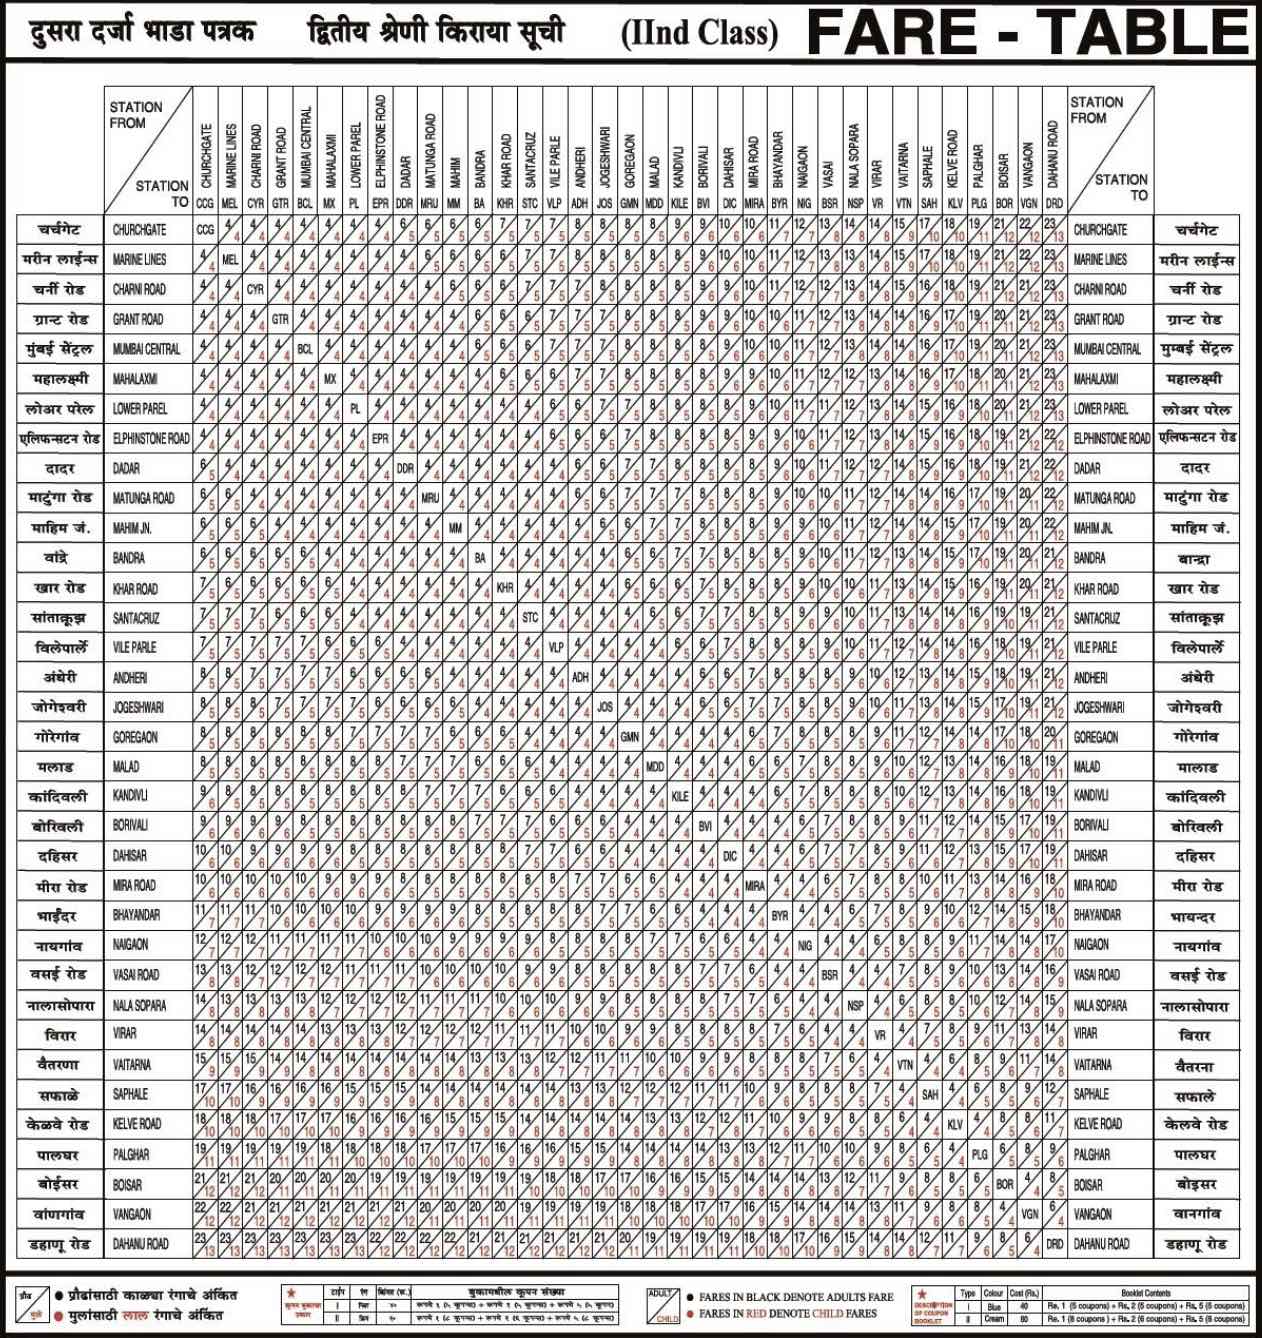
- Relationship: Let’s illustrate relationships with a simple example: A car has four tires. A chart depicting metro ticket prices from location A to location B is a relationship data. The price itself is quantitative.
- Hierarchical: When relationship data is one-directional as a tree, then it is considered hierarchical. For example, a company’s hierarchy: The CEO heads the organization. The VPs report to the CEO. Directors report to the VPs, etc. Another example of hierarchical relationship is how a river splits into tributaries.
Data types
Machine-readable datasets allocate a clear data type for the entire column.
| Human readable | Machine readable |
|---|---|
| Quantitative / Metrics | Integer (3) |
| Float (3.03) | |
| Qualitative / Dimensions | String (“India”) |
| Boolean (True or False) | |
| Text — an entire article | |
| Date | |
| DateTime | |
| Time | |
| etc. |
A table with only Time-series data doesn’t make sense. It is generally accompanied with other information.
Credits
Refined with Harshad Saykhedkar, Co-Founder, xAmbit AI — as part of training for 2023 JournalismAI Academy EMEA and APAC cohorts