

Data audit and cleaning


Many analysts and data scientists spend up to 60-90% of their time in data preparation. This is because bad data skews your insights in the wrong direction and makes the data less actionable.
How maintained is your phone book?

The most common ‘unclean dataset’ example that we deal with everyday is our phone book or address book.
- Completeness: Do you’ve the phone number of everyone you know?
- Updated: When a friend moves homes, their address in your phone book will become outdated.
- Consistent: You’ve two contacts in your phone book with the same name — John Smith — but who is who?
- Accessible: Your company CRM has customer phone numbers but those numbers don’t sync with the address book in your cell phone!
- Relevant: You’ve a flat tire but your car repairperson doesn’t provide this service.
- Reliable: You bought a phone number dataset from a vendor but those numbers are incorrect.
Data cleaning is a world in itself. There are billion dollar companies like Trifacta serving this space. Below are some techniques to build intuition towards identifying dirty data.
For the entire dataset
Is the file format machine readable?
Data extraction techniques like web scraping, PDF scraping, and API integration allow you to transform data locked in human-readable formats into machine-readable data.

Is the dataset queryable?
Often, government data, at least in India, is horizontal because the bureaucrat responsible for publishing it used pivot table. Ideally, you want vertical data.
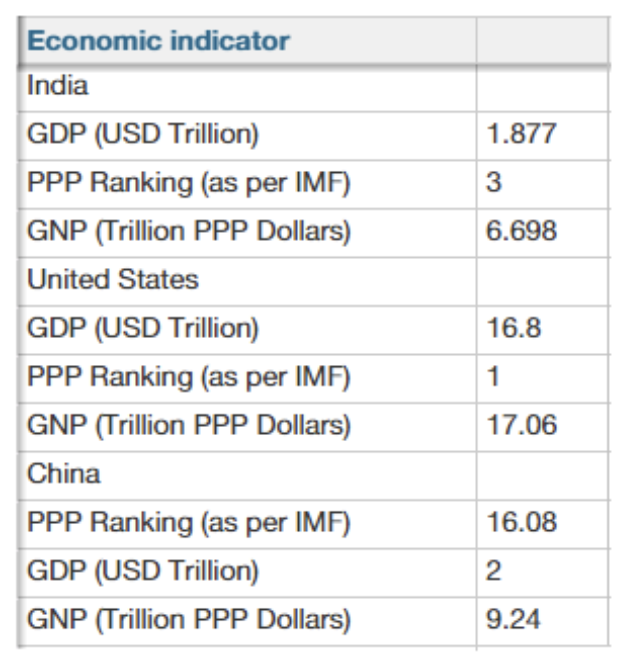
Bad structure
Country names and names of entities are also data and should not be column headers.
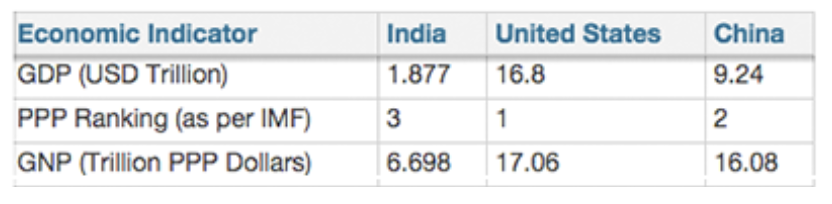
Data should be continuous and must not have blank spaces in rows as sections.
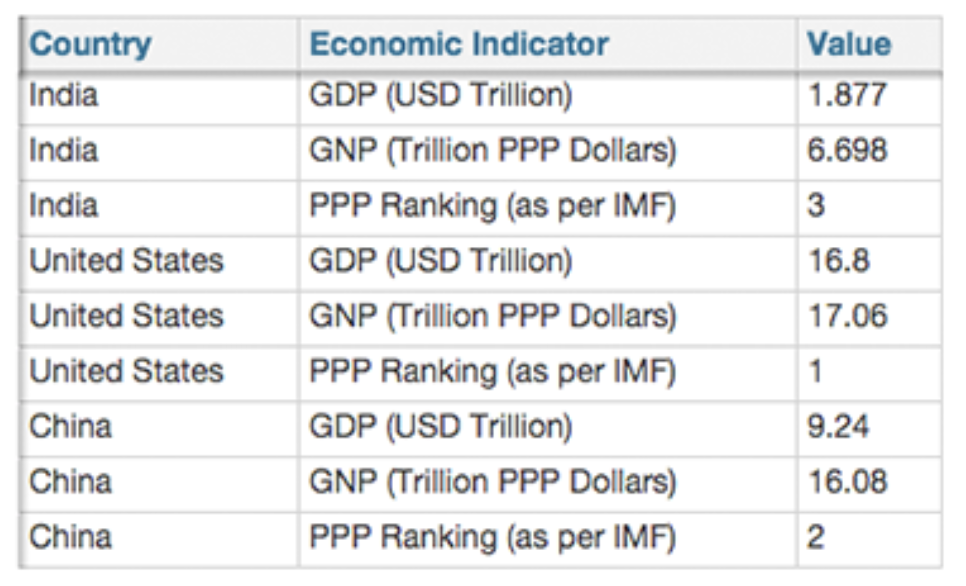
Good structure
Formats where all important entity names, properties and values are part of the data are the best!
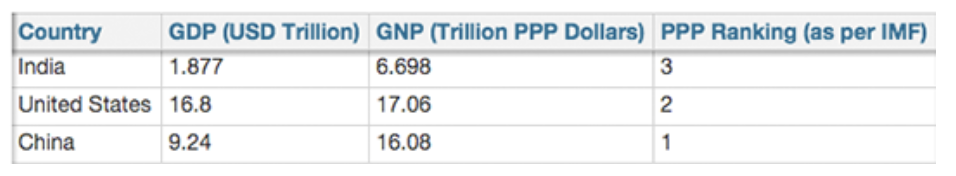
Having major properties as column headers will also work well.
Documentation
You should maintain clear documentation on data provenance (the origin and history of the dataset).
- When was this data collected and last updated?
- Who collected this data and how?
- What were the transformations done on the raw data collected?
All columns
Is there any missing data?
Let’s say you want to identify where do your customers live but only 20% of the users have their address stored. Hence, during data collection, for all columns define is blank (empty string “”) or NULL allowed? If not, what is the default value being stored?
Check for this using the following Google Sheet functions:
= COUNT - COUNTA
// COUNT tells you the number of rows
// COUNTA tells you the number of rows with some value in them
Are the data types being detected property?
For each column, define what is the datatype expected? Often in such situations, the formatting can come in the way.
| Machine Readable Data | Data Type of machine-readable data | Formatted Data | Data Type of formatted data |
|---|---|---|---|
| 3 | Integer | 3% | String |
| 3.03 | Float | $3.03 | String |
| 34950683 | Integer | 3,49,50,683 | String |
| 34950683 | Integer | 34.9 million | String |
| 1/1/2014 | Date | January 1, 2014, Wednesday | String |
Is each row updated and by whom?
Ideally, each dataset should have:
- created_at and updated_at columns so you know when was each row updated.
- created_by and updated_by columns so you know who updated each row.
What is the acceptable error margin of this column?
It is good to know what is the acceptable error margin from each column and hope that the aggregate statistics won’t get significantly skewed.
- For example, when trying to infer ethnicity from surname, which is an inaccurate science, it is okay to have error margin. However, the same might not be acceptable for stock price data.
- If you report on monthly metrics, then it is acceptable to have some error margin in your minute level data.
Can we cross-check against another dataset to build judgment?
If you’ve more than one source of data, then you can ‘cross-check’ percentages, proportions, etc. across both sources and see both match.
Categorical columns
Are there duplicate values in a column that should be unique?
If you are storing username or email is used for login, then username or email (categorical columns) needs to be unique.
- In such situation, during data collections, the number of unique valid values of username or email is the same as the number of rows.
- You should also define a unique ID for each row of data or mix multiple columns to create a unique ID.
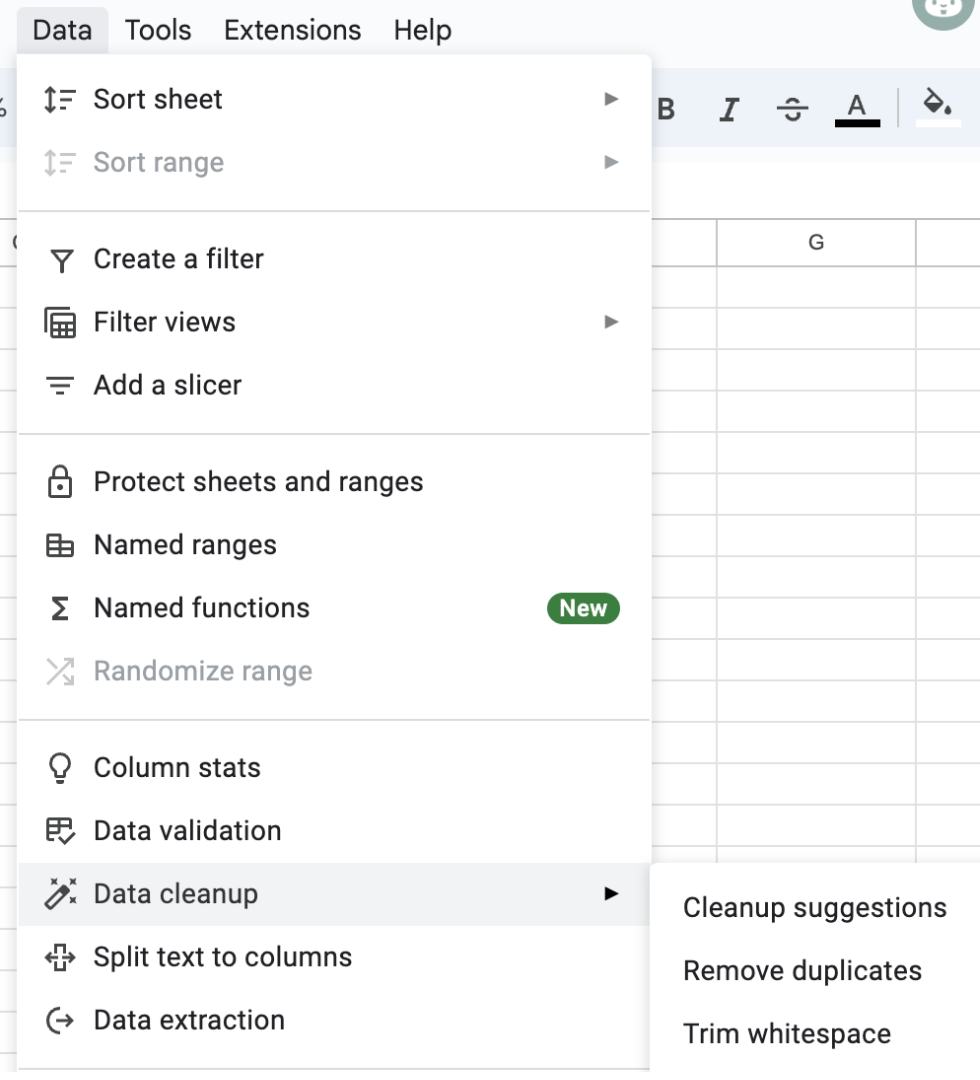
Check for this using the following Google Sheet functions:
= COUNT - COUNTA- Google Sheets provides ready made tools to de-duplicate
Are there inconsistencies in other columns?
Sometimes, we represent the same data point by different values. For example:
- The city of Mumbai is also called Bombay
- The country India can also be recorded by its iso code – IND
- The value Male could be recorded as male, MALE, or M.
- Sometimes words are misspelled because they sound similar.
- Other times, there was a typo and the user added leading or trailing spaces
In programming languages like Python and R, you can use functions like Soundex to find similar sounding words like Ahmedabad and Amdavad. Then there are other methods to find duplicate values, for example, hamming, jaro-winkler, levenshtein, damerau-Levenshtein, cosine, etc.In such situation, during data collections, define data validation for these columns:
- Valid values: A simple survey question like “How did you find us?” can have the following valid values: Social, Search, Friend, Website. In such situations, define the valid values in advance so users get to choose from a dropdown.
- Exclusion: Often, you might also want to give the user the option to tell us how they found us if the answer is not in the valid value list. In this text box, you might want to maintain a negative list of values that you don’t want users to provide.
- Reference table: Are you asking the user which country they live in? In this situation, there is no need to define valid values. Instead, validate against a ready provided reference table.
- Regex pattern: The Social Security Number is a free text field but there is a well-defined pattern it follows. In such examples, you’ll need to define a regex.
Quantitative columns
Should each value be between a min and a max (range)?
The maximum retail price of a product cannot be below zero. In such situations, during data collection, define a minimum and maximum value.
Check for this using the following Google Sheet functions:
= MIN
= MAX
Should each value be of a certain length?
Mobile phone numbers in India are 10-digit numbers. In such situations, during data collection, define the length of the field to be 10.
Check for this using the following Google Sheet functions:
= LENAre there any outliers?
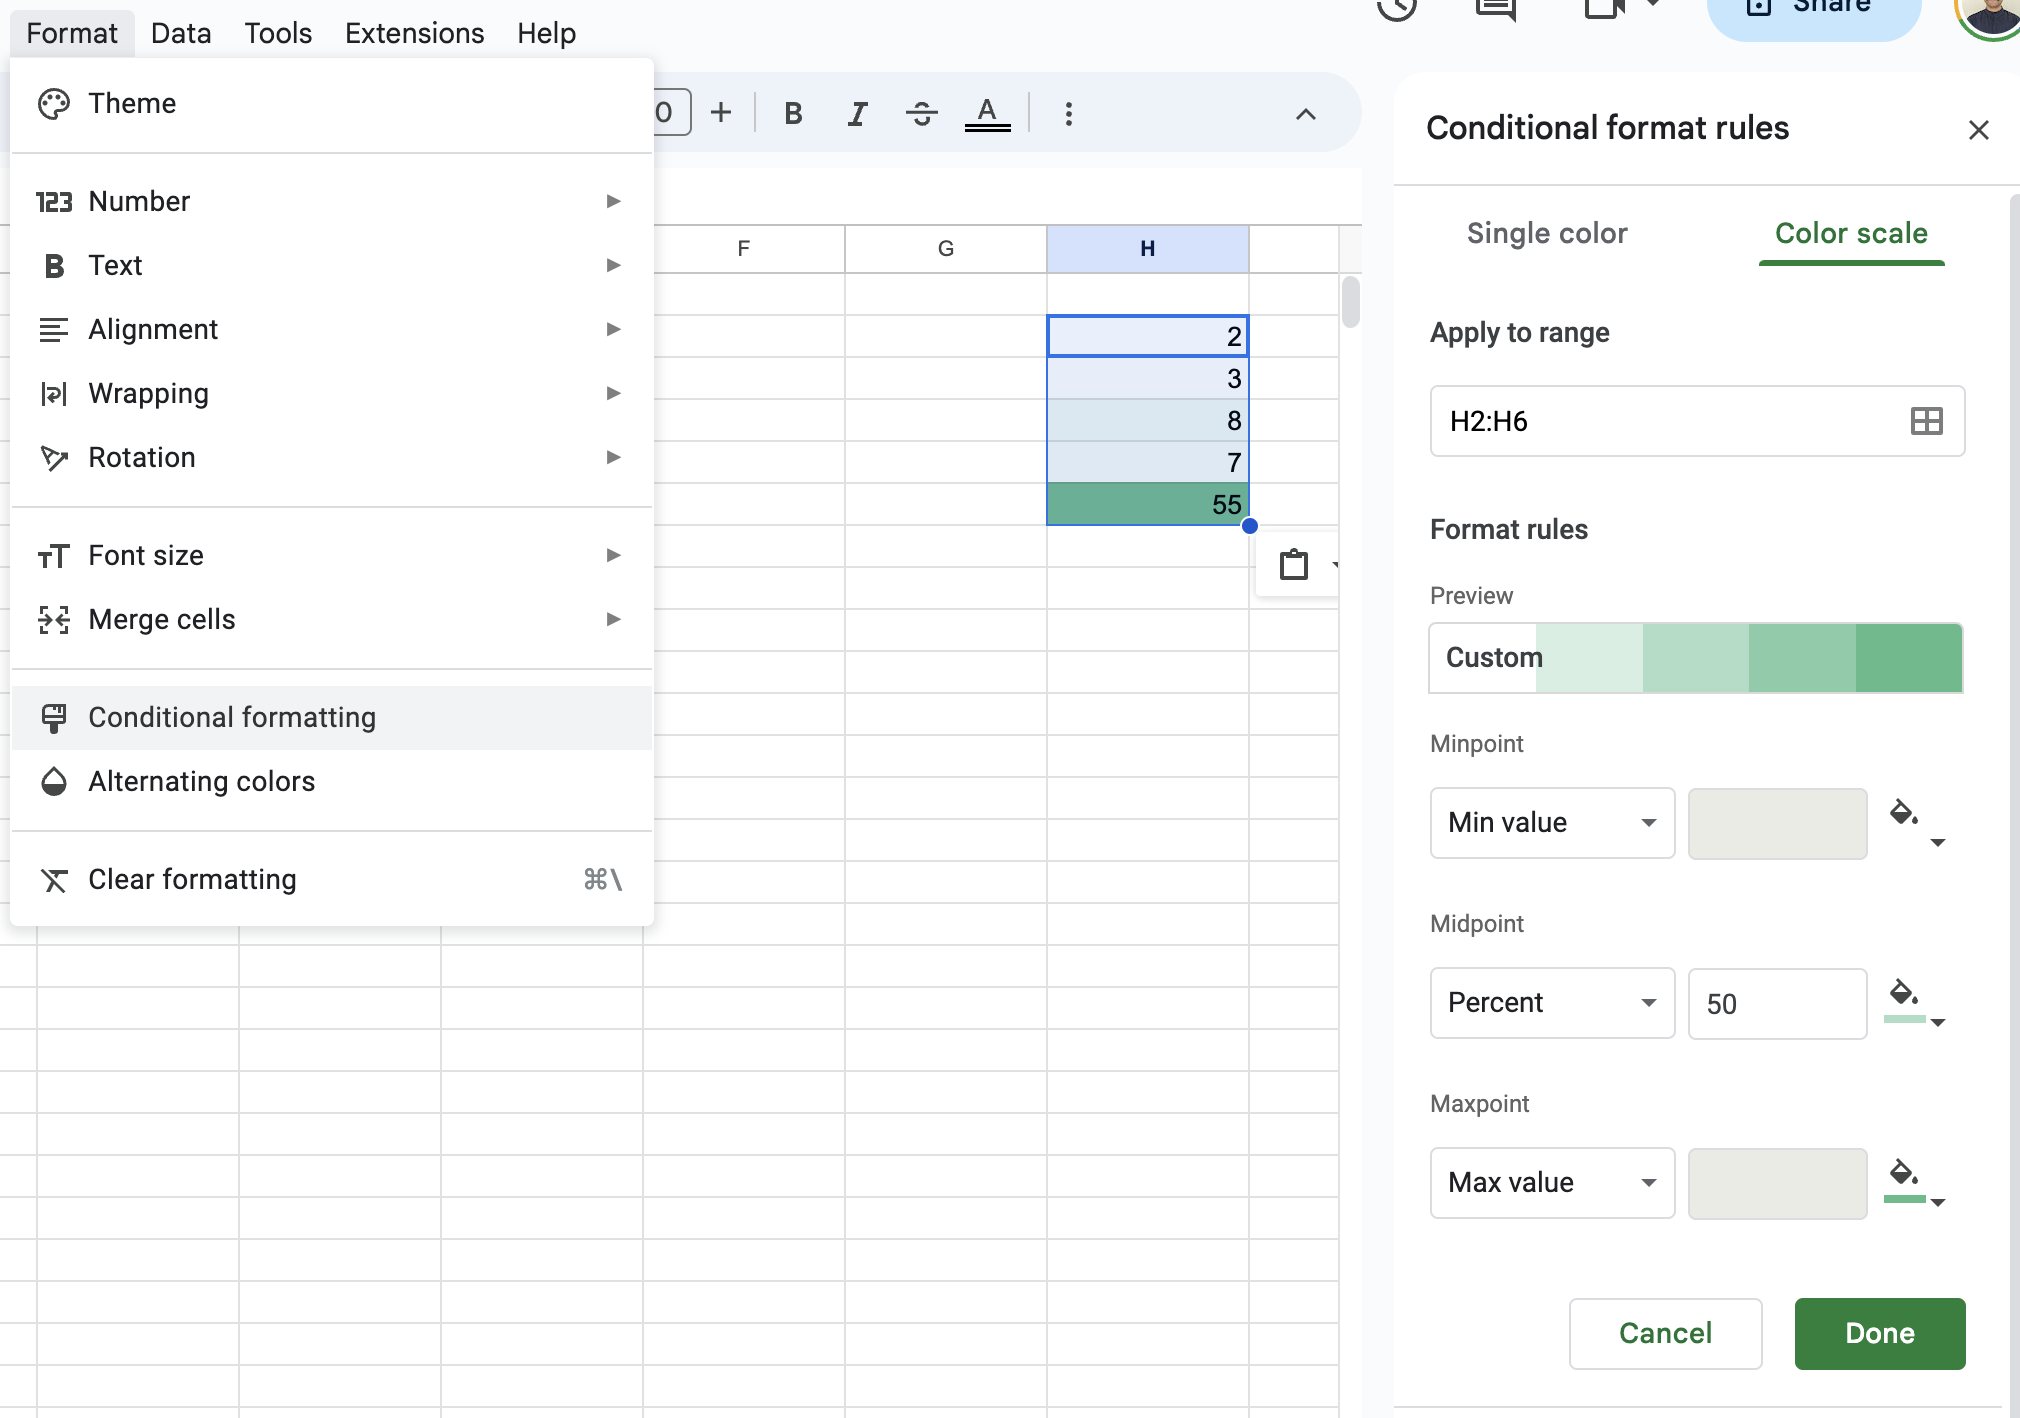
There is a function in Google Sheets called Conditional formatting that will convert a collection of numbers into a heat map. This will make the outliers stand out.
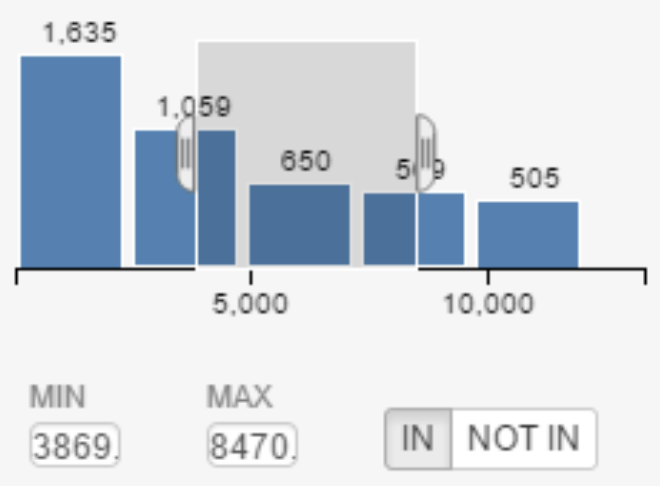
A histogram bins each data-point into 5-10 buckets and shows how the data is distributed. For example, in the histogram below: The data-points are skewed towards the left tail, i.e. the first bucket.
Finally… what if you are not able to clean the data
In such a scenario, it is best to communicate to end consumers about the errors in the data and how it could impact the insights and analysis you are generating.
Credits
Refined with Harshad Saykhedkar, Co-Founder, xAmbit AI — as part of training for 2023 JournalismAI Academy EMEA and APAC cohorts